.

Macro & Market Musings
May 2025

macro-market-musings03 Jun 2025

Key Findings

  • Economic data remained better than expected, especially given the weak survey data seen so far in 2025, but activity continues to slow gradually for now. It remains unclear whether optimism around deregulation, trade, and tax reform will meaningfully lift activity in the near term
  • Financial markets saw a notable improvement in sentiment in May, with equities delivering solid returns. However, bond markets faced rising Treasury yields on a combination of a patient Federal Reserve (the “Fed”), upward pressure on global long-term bond yields, and the realization that U.S. deficits are likely to remain large for years to come
  • The housing market remains fundamentally sound given strong levels of equity and low debt service costs. Inventory levels have normalized, but prices are softening gradually, as sales volumes remain low given challenged affordability


The U.S. Economy

After April’s “month to remember” categorization, May has been a relatively calmer month with a U.S. economy that continues to hold steady despite the tariff-induced volatility. On a positive note, the temporary cease fire on the trade war with China and the Administration’s seemingly more tempered approach to trade policy resulted in improved economic survey data. Activity data, meanwhile, remained relatively constructive – particularly in light of the doom-and-gloom embedded in earlier consumer and business surveys – though it continues to moderate on the margin. The main question around economic data in the coming months will be the trajectory and ultimate intersection of survey and activity data. For now, a narrow consensus appears to be that they will meet in the middle, with slow economic growth but not an outright downturn.

Economic Growth

According to the Bureau of Economic Analysis’ April Personal Consumption Expenditure (“PCE”) report, consumption remains healthy but is
slowing.(1) Inflation-adjusted personal spending advanced 0.1% month-over-month (“mom”), a notable downshift from March’s 0.7% mom increase. Most of the monthly gains were in services spending, particularly in non-discretionary categories such as housing (0.2% mom) and health care (0.3% mom). However, real discretionary spending remained resilient, with recreational services and restaurant spending advancing 0.8% mom and 0.7% mom, respectively. The bottom line is that consumers have continued to spend amid the ongoing tariff uncertainty and market volatility. One probable explanation lies in the robust pace of income growth, which included an increase in transfer payments associated with the Social Security Fairness Act passed in January and wages that continued to rise at a steady clip.

Inflation and Labor Market

The April PCE report also showed marginal progress on the Fed’s disinflationary journey. Prices were generally muted in April and there is little compelling evidence that tariffs have had a material impact on inflation just yet. Despite the muted readings thus far, consumers continue to show concerns about inflation and numerous large retailers have threatened to raise prices if tariff rates remain meaningfully elevated. Both headline and core PCE inflation advanced at a 0.1% mom rate in April, lowering the year-over-year rate to 2.1% and 2.5%, respectively. At the same time, recent data has painted a labor market with low levels of hiring and job offers, but limited firing or layoffs. The April employment report was better than expected and showed healthy hiring in an uncertain environment, while the Job Opening and Labor Turnover Survey improved slightly. Openings rose to 7.4 million, a level that roughly balances the number of openings and unemployed. Recall that over the past 4+ years, the number of job openings had at times significantly exceeded the number of unemployed (see panel 1).

Panel 1:

Labor Demand Moderating Rapidly

Financial Markets

Markets in May were dominated by a sharp selloff in interest rates, with focus on the long end of the Treasury curve, driven primarily by a rise in real yields. Despite higher rates, market volatility declined, risk assets performed well, but the Dollar ended the month slightly weaker. The rate move reflected a combination of firm U.S. economic data, a cautious stance from the Fed, increased fiscal concerns, and pressure from global sovereign yield curves — particularly out of Japan. Meanwhile, agency mortgage-backed securities (“MBS”) performed well given lower rate volatility, though they lagged other spread sectors amid renewed focus around the government-sponsored enterprises (“GSEs”).

Interest Rates and Volatility

Treasury yields rose meaningfully over the month, with 2-year yields moving above 4% and the long bond briefly trading above 5%. Notably, the move was driven by an increase in real rates, as breakeven inflation expectations held steady, suggesting that investors were pricing in higher-for-longer policy rates and concerns over Treasury supply rather than inflation per se. Amid the rise in yields, the Treasury yield curve ended the month slightly flatter, as the 2-year yield ended the month 35 basis points (“bps”) higher while 10-year yields ended 30 bps higher.

Throughout May, the Fed remained in wait-and-see mode. Despite some softness in recent inflation data, officials emphasized patience in speeches throughout the month, underscoring the narrative that the bar for rate cuts remains high and will be data dependent. This was reinforced by a strong labor market report early in May, which showed continued hiring momentum and kept the door closed to a near-term cut. As a result, markets scaled back expectations for easing, with overnight index swaps pricing in around 50 bps of cuts by year-end — down from over 100 bps at the end of April.

Adding to the upward pressure on yields was fiscal policy. The House of Representatives passed legislation to extend key parts of the Tax Cuts and Jobs Act of 2017. While the bill still needs to pass the Senate, the version currently under consideration front-loads a significant amount of spending and deficits. The implication for markets was clear: a renewed focus on near-term supply and fiscal discipline drove a “fiscal premium” into long-end yields. Using the House’s draft legislation, the Congressional Budget Office estimates that primary deficits are likely to exceed 2% in every year of the 10-year forecast horizon, which does not include a potential economic downturn (see panel 2). Given the rising debt, interest costs are also going to increase Treasury funding needs. Investors have pushed yields further in order to receive compensation for the rising debt, as measures of 10-year term premium reached their highest levels in over ten years.


Panel 2:

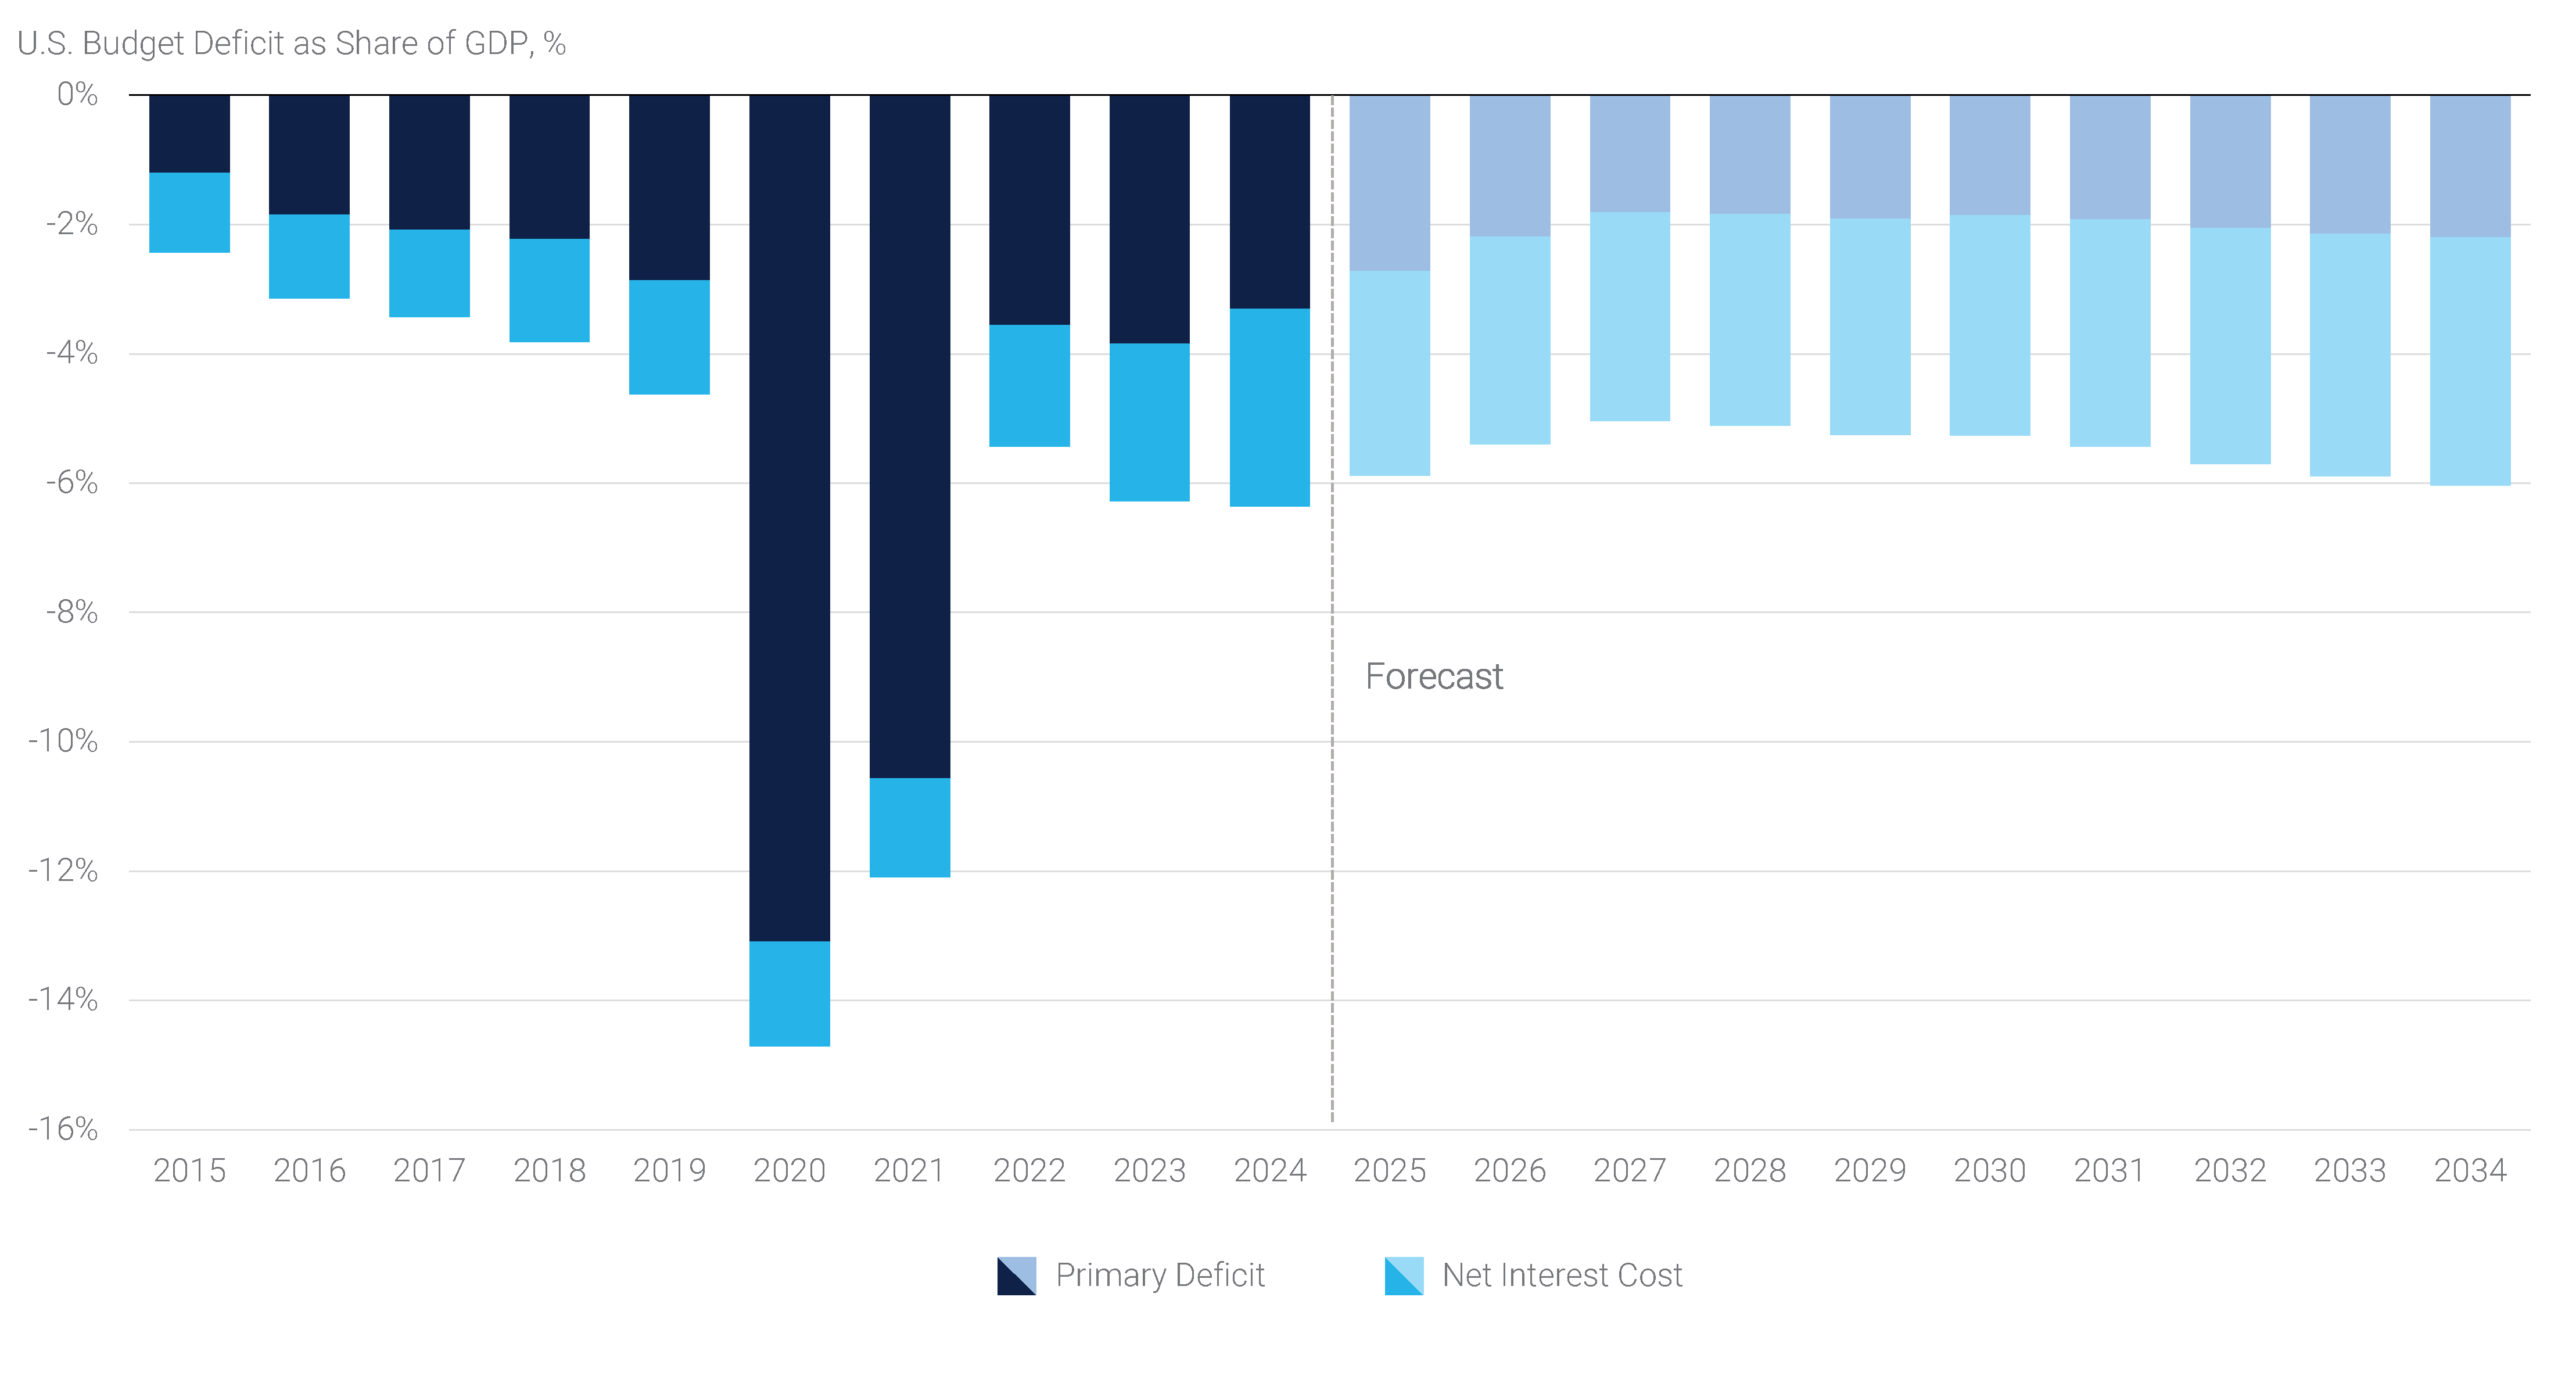
Primary Deficits Expected to Remain Meaningful


Global sovereign yield curves reinforced the shift higher in Treasury yields, with a notable selloff in Japanese Government Bonds (“JGBs”). Long-end Japanese yields climbed to record highs following weak bond auctions at the end of the month, continuing a trend that’s been building for some time, with the 40-year JGB yield rising nearly 100 bps since early April. These moves are occurring as Japan’s central bank gradually steps away from ultra-accommodative monetary policy, leaving long-end yields more exposed to market dynamics and creating a more price-sensitive demand picture.

Agency MBS

Agency MBS delivered modestly positive returns in May, benefiting from lower implied rate volatility and the broader move higher in yields. As interest rates rose, investors gravitated toward higher coupon securities to capture more attractive carry and reduce exposure to prepayment risk in a higher rate environment. Real money demand returned after a slower April, helping to stabilize the sector. The Bloomberg U.S. MBS Index recorded 19 bps of excess return over the month.

Additionally, headlines around GSE reform re-emerged, with signs that the Trump-era push toward privatization has gained momentum following two social media posts from the President late in May. While market participants broadly acknowledge the complexity of removing the GSEs from federal conservatorship, the increased focus raised uncertainty and potential for structural changes in the mortgage market. Despite these headlines, policymakers appear aware of the need for a gradual, well-communicated process that avoids major disruptions to mortgage credit availability and rates.

Equities, Credit, and Currencies

In contrast to the rate selloff, equities ended the month with gains as the S&P 500 delivered a 6.3% total return – the strongest May in at least two decades. Investors appeared to take comfort in continued economic resilience, solid corporate earnings, and extended tariff relief. While valuations remain stretched in some sectors, the market largely shrugged off higher yields as growth expectations remained intact.

Credit markets also performed well, with both investment grade and high yield spreads tightening. Healthy demand, stable fundamentals, and supportive technicals drove strong performance across the board. Corporate spreads tightened to levels seen in March, helping the Bloomberg U.S. Aggregate Corporate Bond Index post 127 bps of excess return for the month.

The Dollar, despite the rise in U.S. yields, finished the month slightly lower. This reflects, in part, the global nature of the bond selloff — rising yields abroad helped offset the relative rate advantage typically enjoyed by the Dollar. Additionally, ongoing uncertainty around U.S. fiscal policy and tariffs also weighed on sentiment. While the economic backdrop has improved, investors remain cautious given elevated deficits and the fact that average U.S. tariff rates are still well above pre-2025 levels.

Slowing Housing Demand Pressures Inventories

After the Fed began hiking interest rates in 2022, many market observers expected weakness in the housing market and a softening in home prices, as housing affordability deteriorated meaningfully. Home prices ultimately remained relatively firm, rising 6.9% and 4.8% in 2023 and 2024,(2) respectively, as low inventories offset slowing demand from potential home buyers. Fast forwarding to today, affordability remains challenged given high mortgage rates and high housing costs. However, inventories have grown, in large part driven by continued lackluster housing demand, resulting in a slowing of home price appreciation. 

Elevated mortgage rates remain the biggest impediment to affordability, as the 30-year fixed rate mortgage measured by Freddie Mac averaged 6.8% in May, above levels seen last September, before the Fed cut interest rates by 100 bps. The higher rates are caused by elevated long-end Treasury yields and wide mortgage spreads. Home price levels remain well above pre-pandemic levels, rising 57% from the 2019 year-end levels, while median family incomes are only 29% higher over the same period. The combination of rising prices and high mortgage rates have kept annual mortgage payments as a share of family income near a historically elevated 25% for three consecutive years (see panel 3). To make matters even more challenging for potential home buyers, this share does not account for rising property taxes and insurance premiums.


Panel 3:

Housing Affordability Remains a Challenge

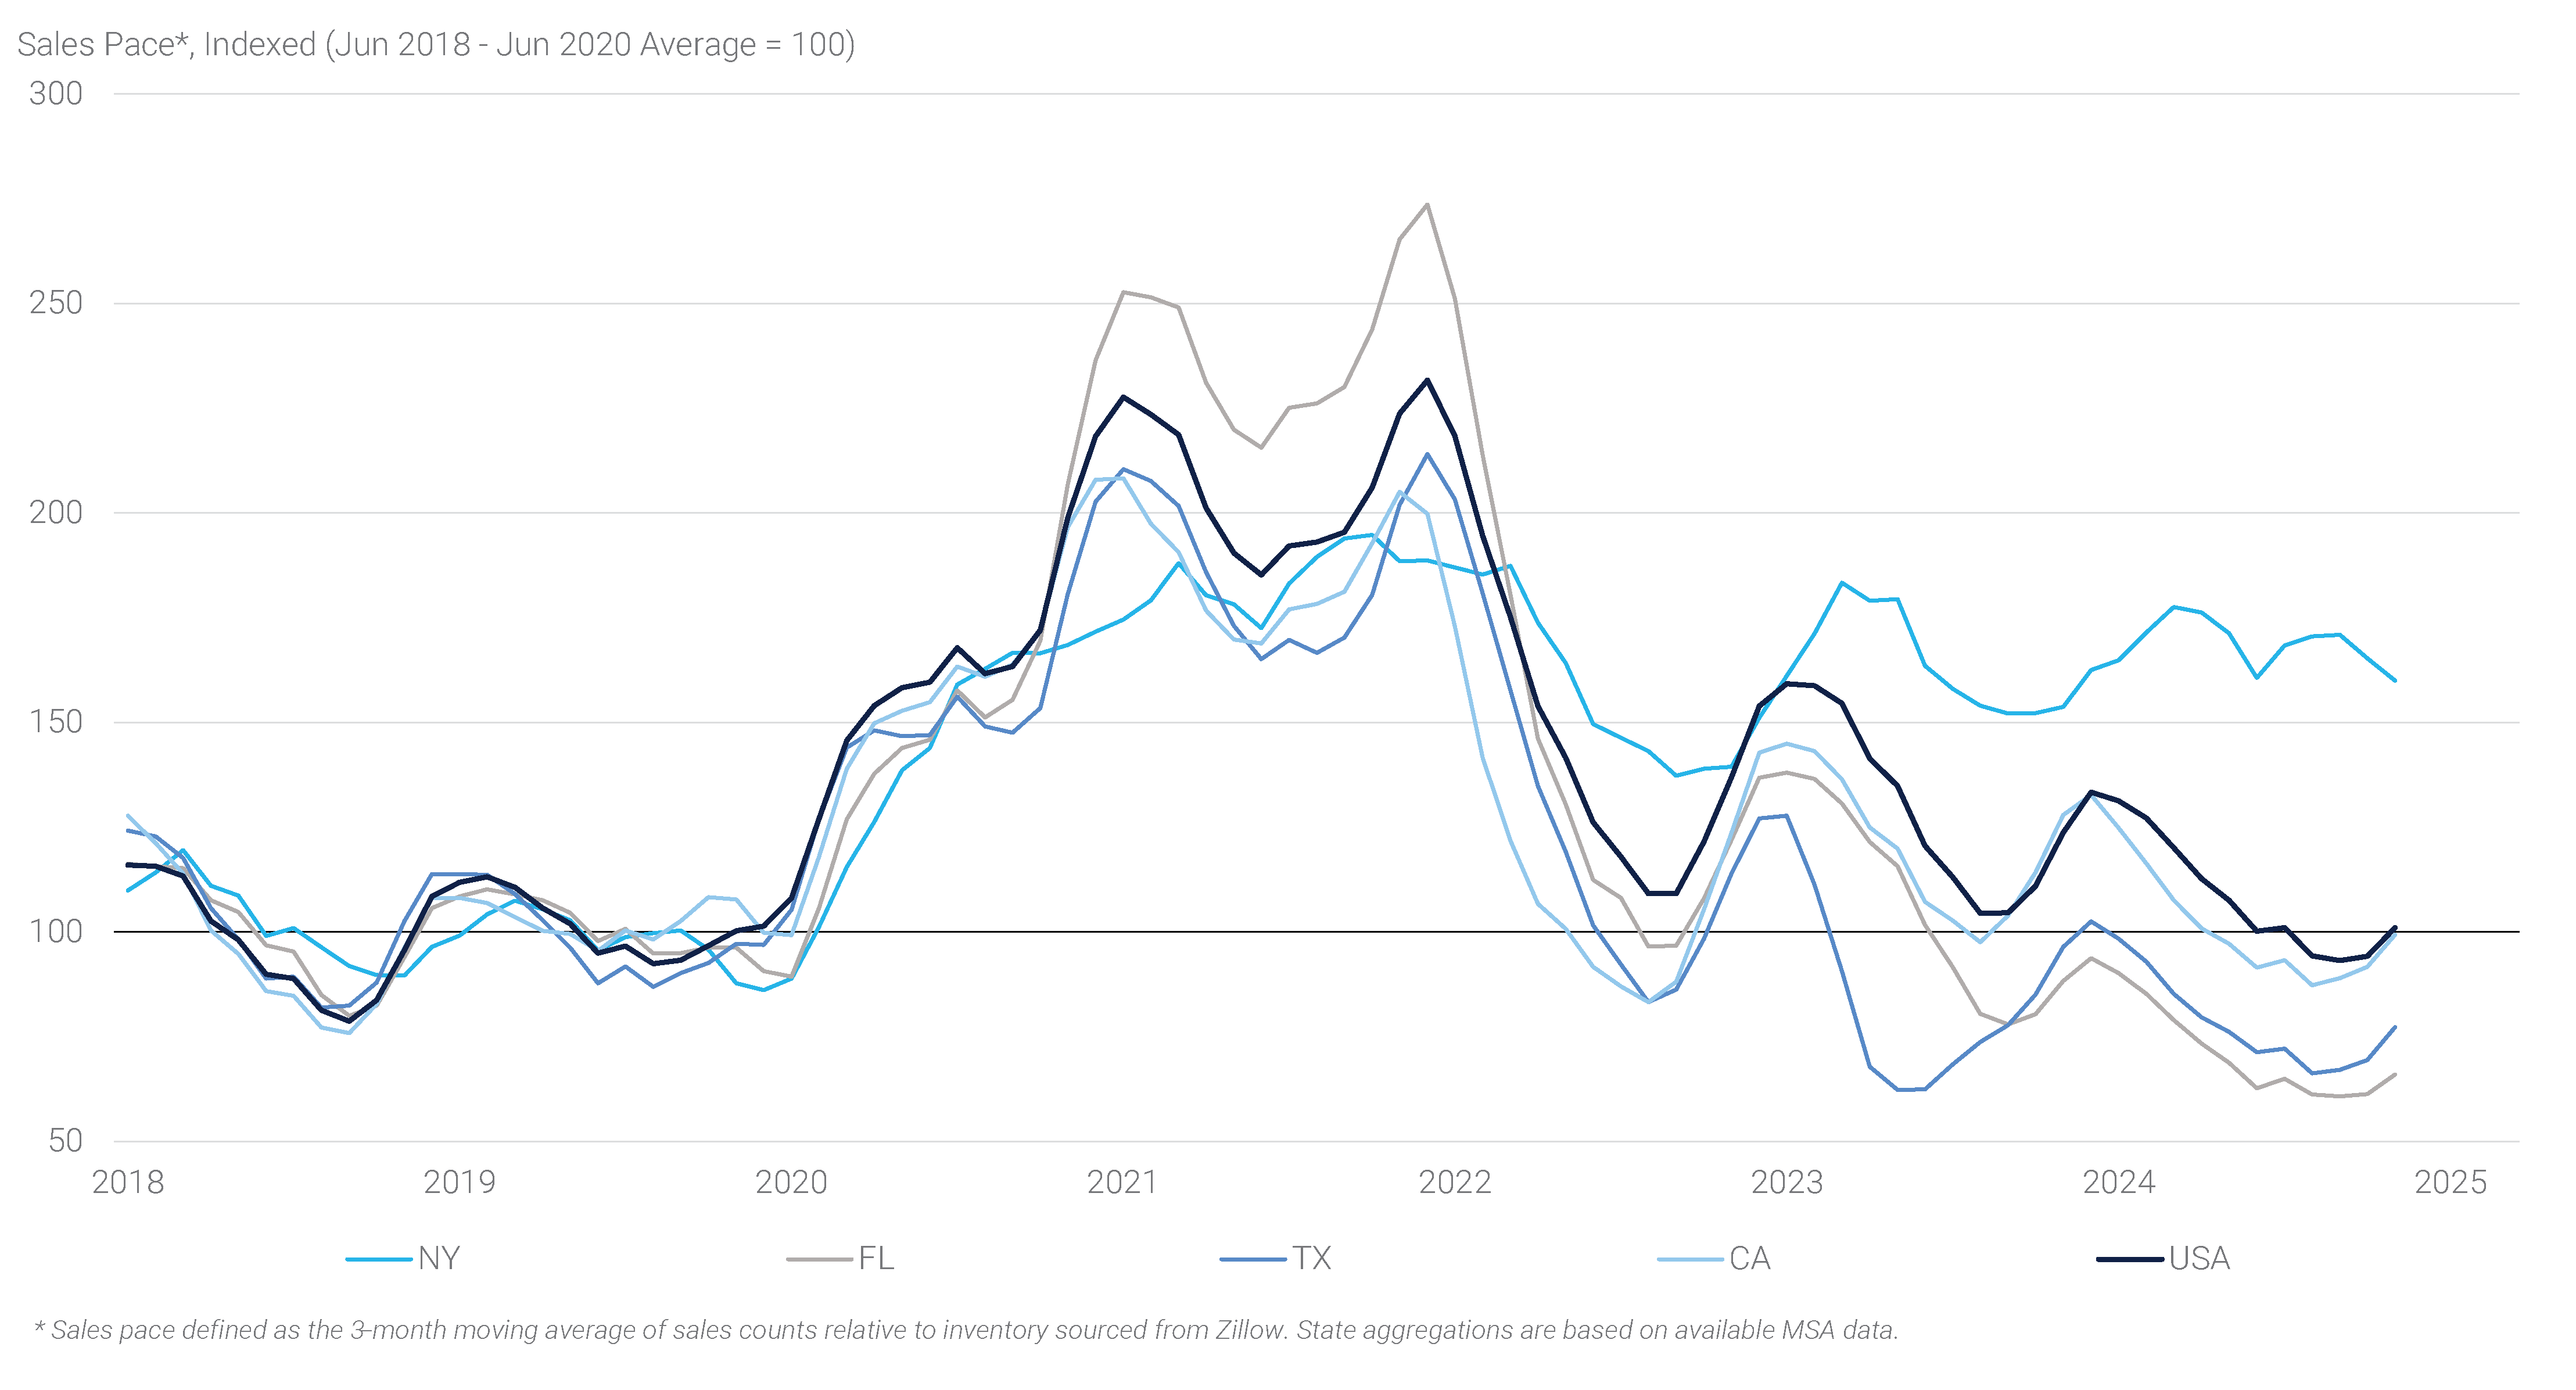
The rise in inventories appears to be driven by a continued slow pace of sales, rather than a flood of listings, implying homeowners are forced or are economically incentivized to move. Using Zillow data, we calculate the sales pace for several large states (see panel 4).  As shown, this pace has normalized across the country but slowed more meaningfully in Florida and Texas, two states that benefited from migration in the aftermath of the pandemic. Meanwhile, New York continues to see a sales pace well above average, helping to explain the lower inventory and stronger price gains.


Panel 4:

The Pandemic Housing Boom Is So Over

The combination of slow sales and poor affordability suggests that home price growth could continue to slow in coming months as inventories build. Notably, Zillow data for April already showed a second consecutive month-over-month decline in prices, indicating that official home price indices might show similar weakness when released towards the end of June. However, we expect the declines to be gradual as supply only marginally outpaces demand. Builders will continue to manage their pipelines as necessary, while few existing homeowners appear forced to list their inventory for sale. The housing market should therefore continue its hibernation at low levels of activity until affordability improves significantly or overwhelming supply drives prices much lower.

Disclaimer

Endnotes