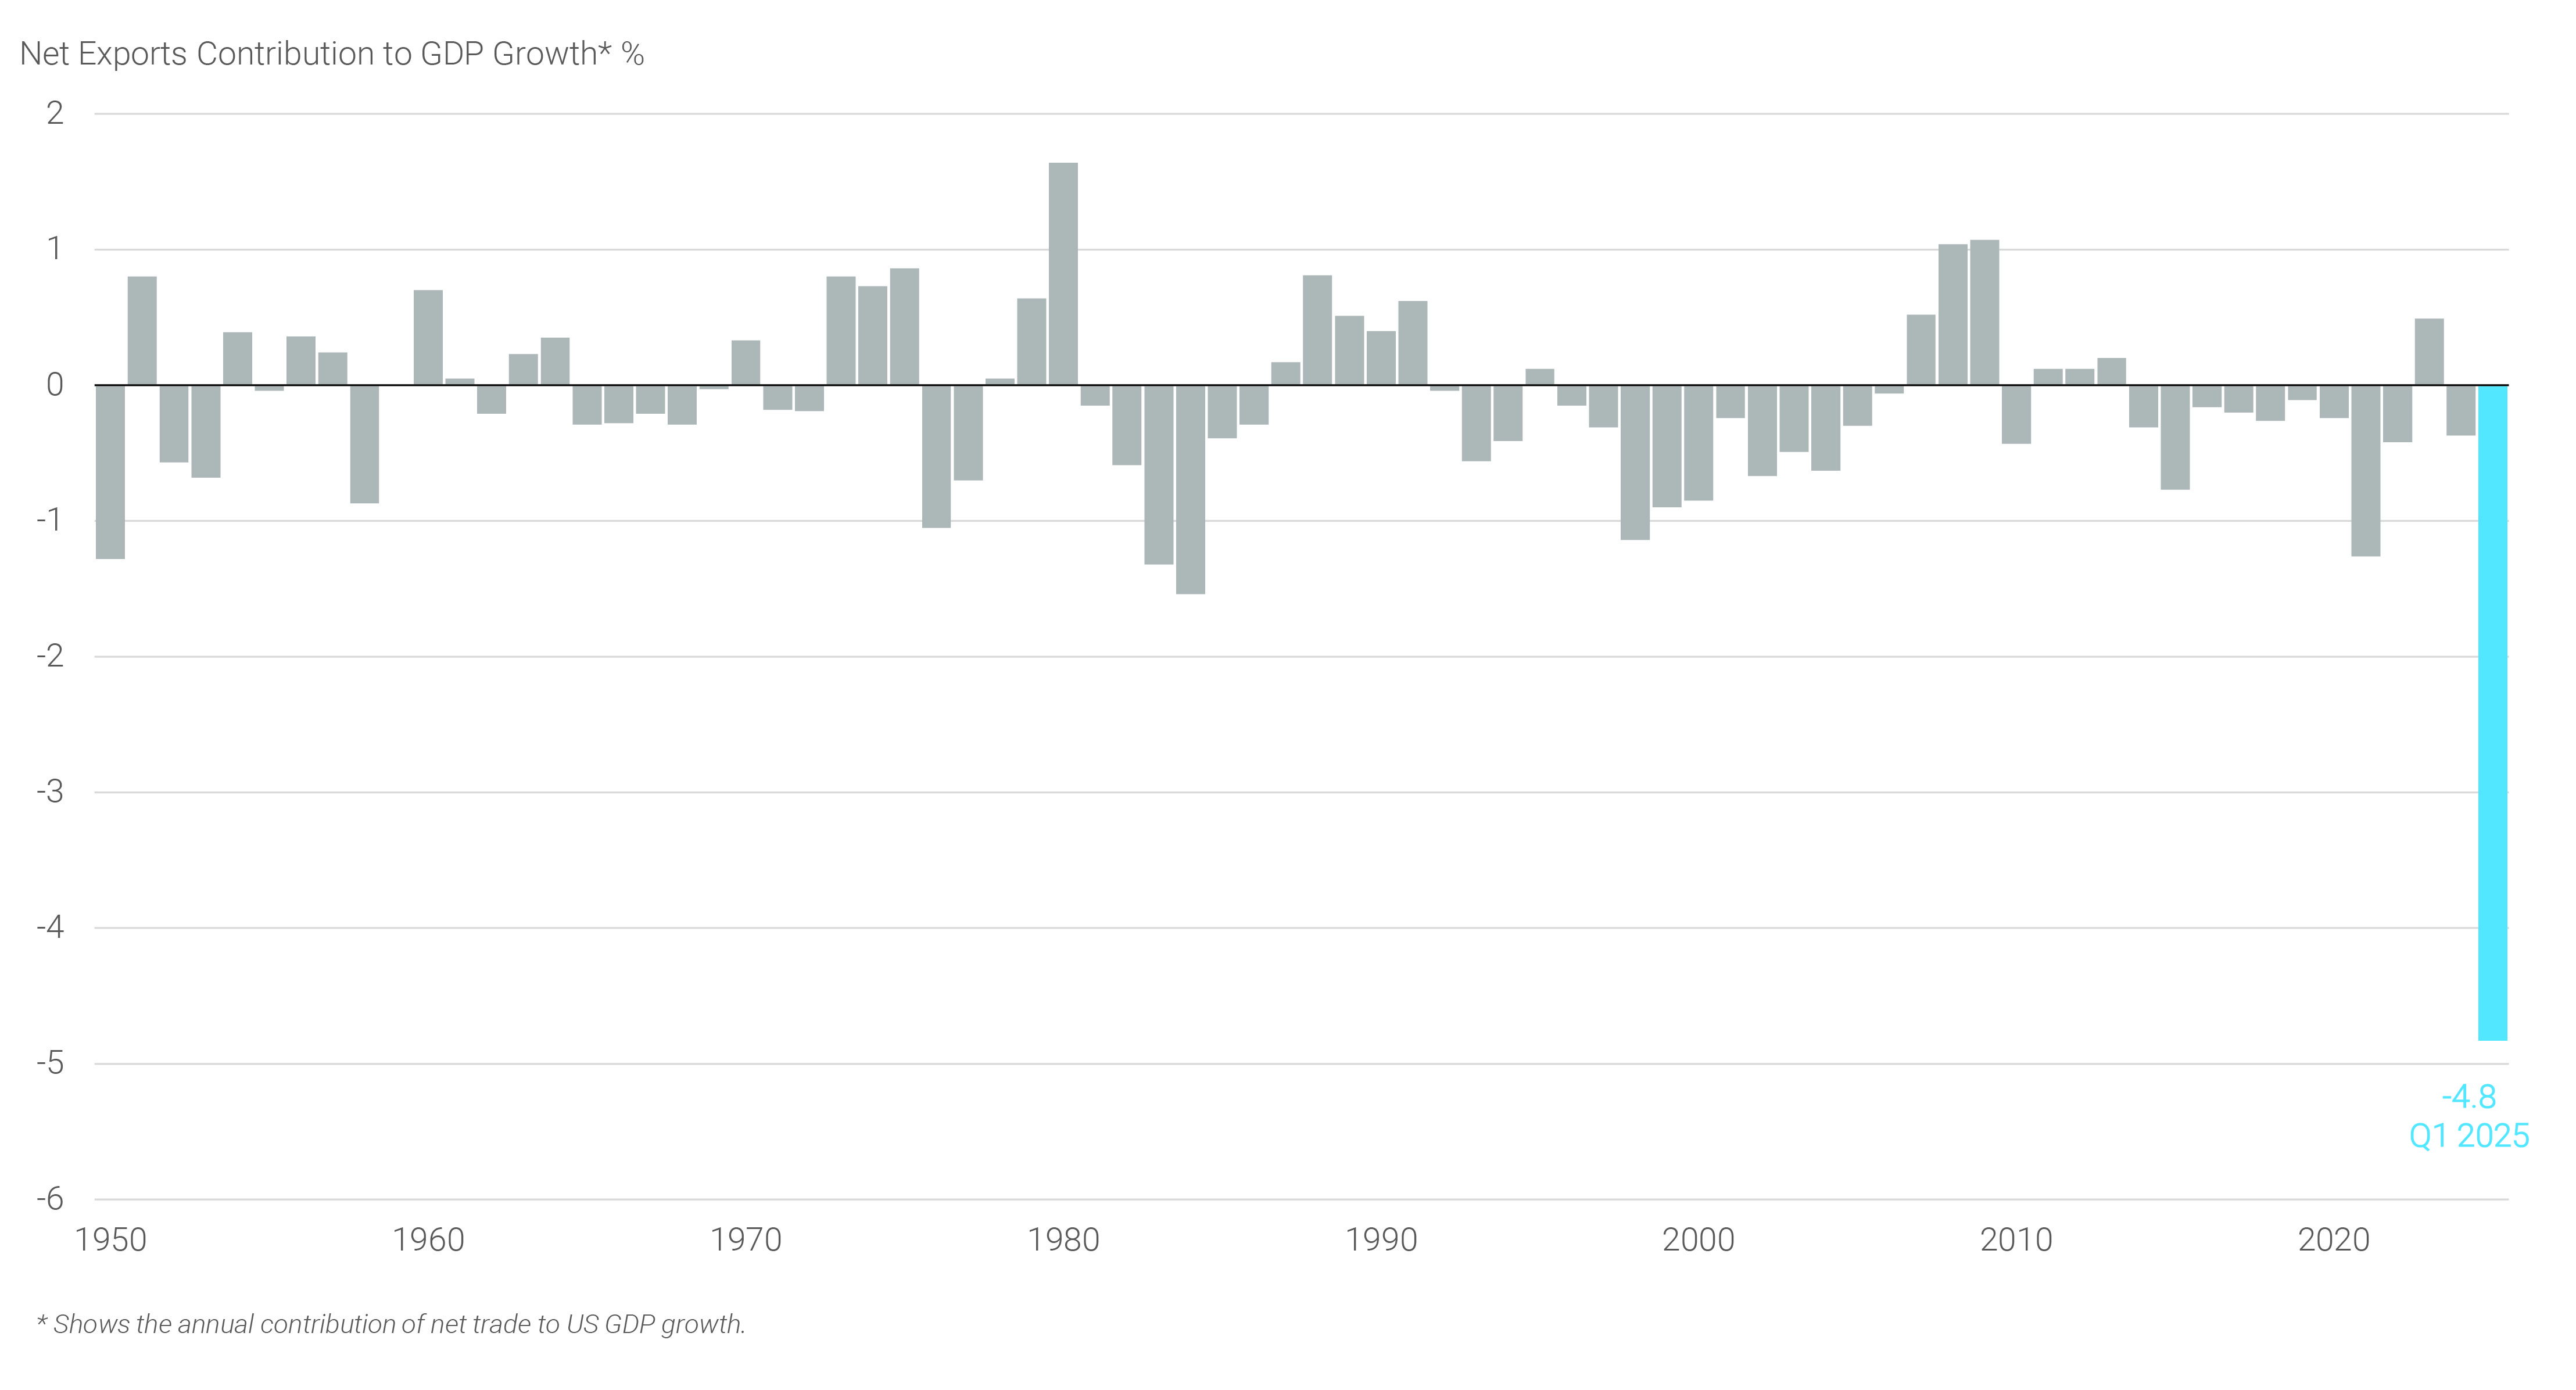
GDP Weighed Down by Import Surge
Consumption grew 1.8% SAAR in the first quarter, as strong March spending helped offset more muted activity in January and February. Even though a significant monthly increase in car sales drove the higher personal spending in March, many services spending categories rebounded as well. Taking a step back and looking at Q1 wholistically, three high level factors appear to have shaped consumer spending:
- Moderation of spending from higher levels at the end of 2024,
- A historically cold January, and
- Elevated trade policy uncertainty that might have led consumers to frontload purchases.
The rebound in services spending seen in March suggests that the first two factors mattered more than the last one, at least for now. Underpinning the U.S. consumer, even with lower confidence, were continued robust personal income gains anchored by solid wage growth. Thus, we would expect personal consumption to hold up until income growth weakens or price pressures start bubbling up in the economic activity data.
Finally, it seems fair to assume that the negative impact from net trade in Q1 data should be reversed and result in a tailwind for Q2 GDP. A slowdown in imports, which has been visible in part in declining U.S. port volumes in April, should reverse the drag on GDP seen in Q1 as trade patterns either settle into historical averages or weaken beyond them. Assuming real final sales to private domestic purchasers do not slow at a rapid pace in Q2, GDP should be positive for the quarter. This does not necessarily constitute a strong economy, but it would likely push a feared economic downturn further out the calendar.
Labor Market
Turning to the employment picture, data received for April painted a labor market with low levels of hiring, but limited firing or layoffs and moderating wage growth. Nonfarm payrolls increased by 177,000 and the unemployment rate remained unchanged at 4.2%. However, downward revisions to job growth in the prior two months took some shine off the report and left the three-month average pace of hiring essentially unchanged from initial estimates of the same metric one month ago. Hiring was relatively broad-based across industries, with the diffusion indices(1) improving for both 1- and 3-month measures. Following meaningful disagreement between surveys for most of last year, the household survey was in line with the employer survey for a second consecutive month. Notably the overall labor force participation rate (“LFPR”) improved to 62.6%, with the prime age (25–54 years old) LFPR rising to the highest level since September 2024, as 518,000 people entered the labor force – of those, 436,000 were able to find a job.
Nevertheless, there are some signs worth monitoring as overall employment growth has moderated and employers are growing cautiously pessimistic about the outlook. According to the Bureau of Labor Statistics, job openings fell more than expected to 7.2 million in March across a broad set of industries. This led to the job openings per unemployed ratio to drop to 1.02 – a post-pandemic low. Labor market entrants and re-entrants continue to have difficulty finding a job as the hiring rate was unchanged at 3.4% despite a slight uptick in voluntary separations indicating that businesses’ interest in bringing on new workers has cooled.(2) The median duration of unemployment has gradually moved higher since mid-2022 and stood at 10.4 weeks in April, consistent with what appears to be a steady rise in continuing claims for unemployment insurance. Lastly, wage growth continues to moderate as shown in both the payrolls and the Q1 Employment Cost Index report. Despite the slowdown in wage growth, April saw a rise in total hours worked indicating stronger income growth in the aggregate. As noted above, solid income gains will be needed to support consumption as sentiment fades,(3) especially considering that the savings rate declined to 3.9% in March and remains below historical averages.
Financial Markets
Uncertainty weighed heavily on markets in April as tariff-related announcements triggered a sharp and immediate deterioration in risk sentiment. Market participants quickly repriced expectations for U.S. growth resulting in a meaningful move across markets: equities declined and the dollar weakened, but unlike in a typical risk-off move, U.S. debt markets sold off. Ten-year Treasury yields traversed a 70-basis point (“bps”) range within one week in early April as term premium surged. The ICE BofA Move Index – a measure of short-term implied interest rate volatility – rose to its highest levels since the fall of 2023.
By month-end, volatility had subsided as trade-related concerns shifted into a wait-and-see mode amid ongoing negotiations. First quarter corporate earnings helped improve sentiment as they have been relatively strong thus far, leading to only modest downward revisions to 2025 earnings expectations, though uncertainty around these forecasts has certainly increased. Altogether, April’s price action highlights a few notable takeaways.
First and most importantly, the U.S. dollar depreciated significantly and remains weak, even after the worse-case tariff scenario was scaled back. Historically, import tariffs tend to strengthen the home currency, in turn alleviating some of the tariff’s effect on raising import prices. However, following April’s announcement, most G10 currencies appreciated against the dollar. It appears unlikely that foreign investors have sold U.S. assets on a large scale at this point. Nonetheless, foreign demand warrants increased attention going forward.
Over the past two decades, foreign investors have heavily allocated capital to U.S. assets due to economic outperformance and improved yields, leading the U.S. to be the center of global capital flows. For example, net portfolio investment in U.S. debt and equities, defined as the difference between investment holdings of foreigners in the United States minus the holdings of U.S. domiciled investors abroad, have doubled this decade – well ahead of potential market value gains on these portfolios (see panel 3).
Panel 3:
Foreign Investment into U.S. Stocks Has Been Strong
Flows have been particularly strong in equities as U.S. companies were seen as leading global innovation, such as in artificial intelligence, with the U.S. simultaneously offering the most efficient open capital markets worldwide.
The Trump Administration’s trade policy has raised concerns about potentially slower economic growth and lower corporate earnings, in turn questioning whether U.S. economic exceptionalism will continue. While this could prompt foreign investors to seek investments in other jurisdictions, the process is likely to be protracted over years rather than the first few days of April 2025. The U.S. dollar remains the centerpiece of global finance and U.S. markets represent foreign investors’ “TINA” – there is no alternative.
Second, the uncertainty prompted widespread de-risking in U.S. fixed income markets. Treasury yields spiked relative to same-maturity swap yields, with 30-year spreads tightening by as much as 23 bps at the height of the bearish sentiment. This deleveraging drove broad cheapening across fixed income assets, as balance sheet intensive assets became costlier to hold for investors. Agency MBS were not unaffected by the environment, delivering a negative excess return of 38 bps in April,(4) as sentiment and higher volatility weighed on mortgage spreads. Of note, weak risk sentiment pushed credit spreads even wider, resulting in a 62 bps negative excess return for the Bloomberg U.S. Aggregate Corporate Bond Index, though investment grade bonds arguably had tighter valuations than mortgages entering the month.
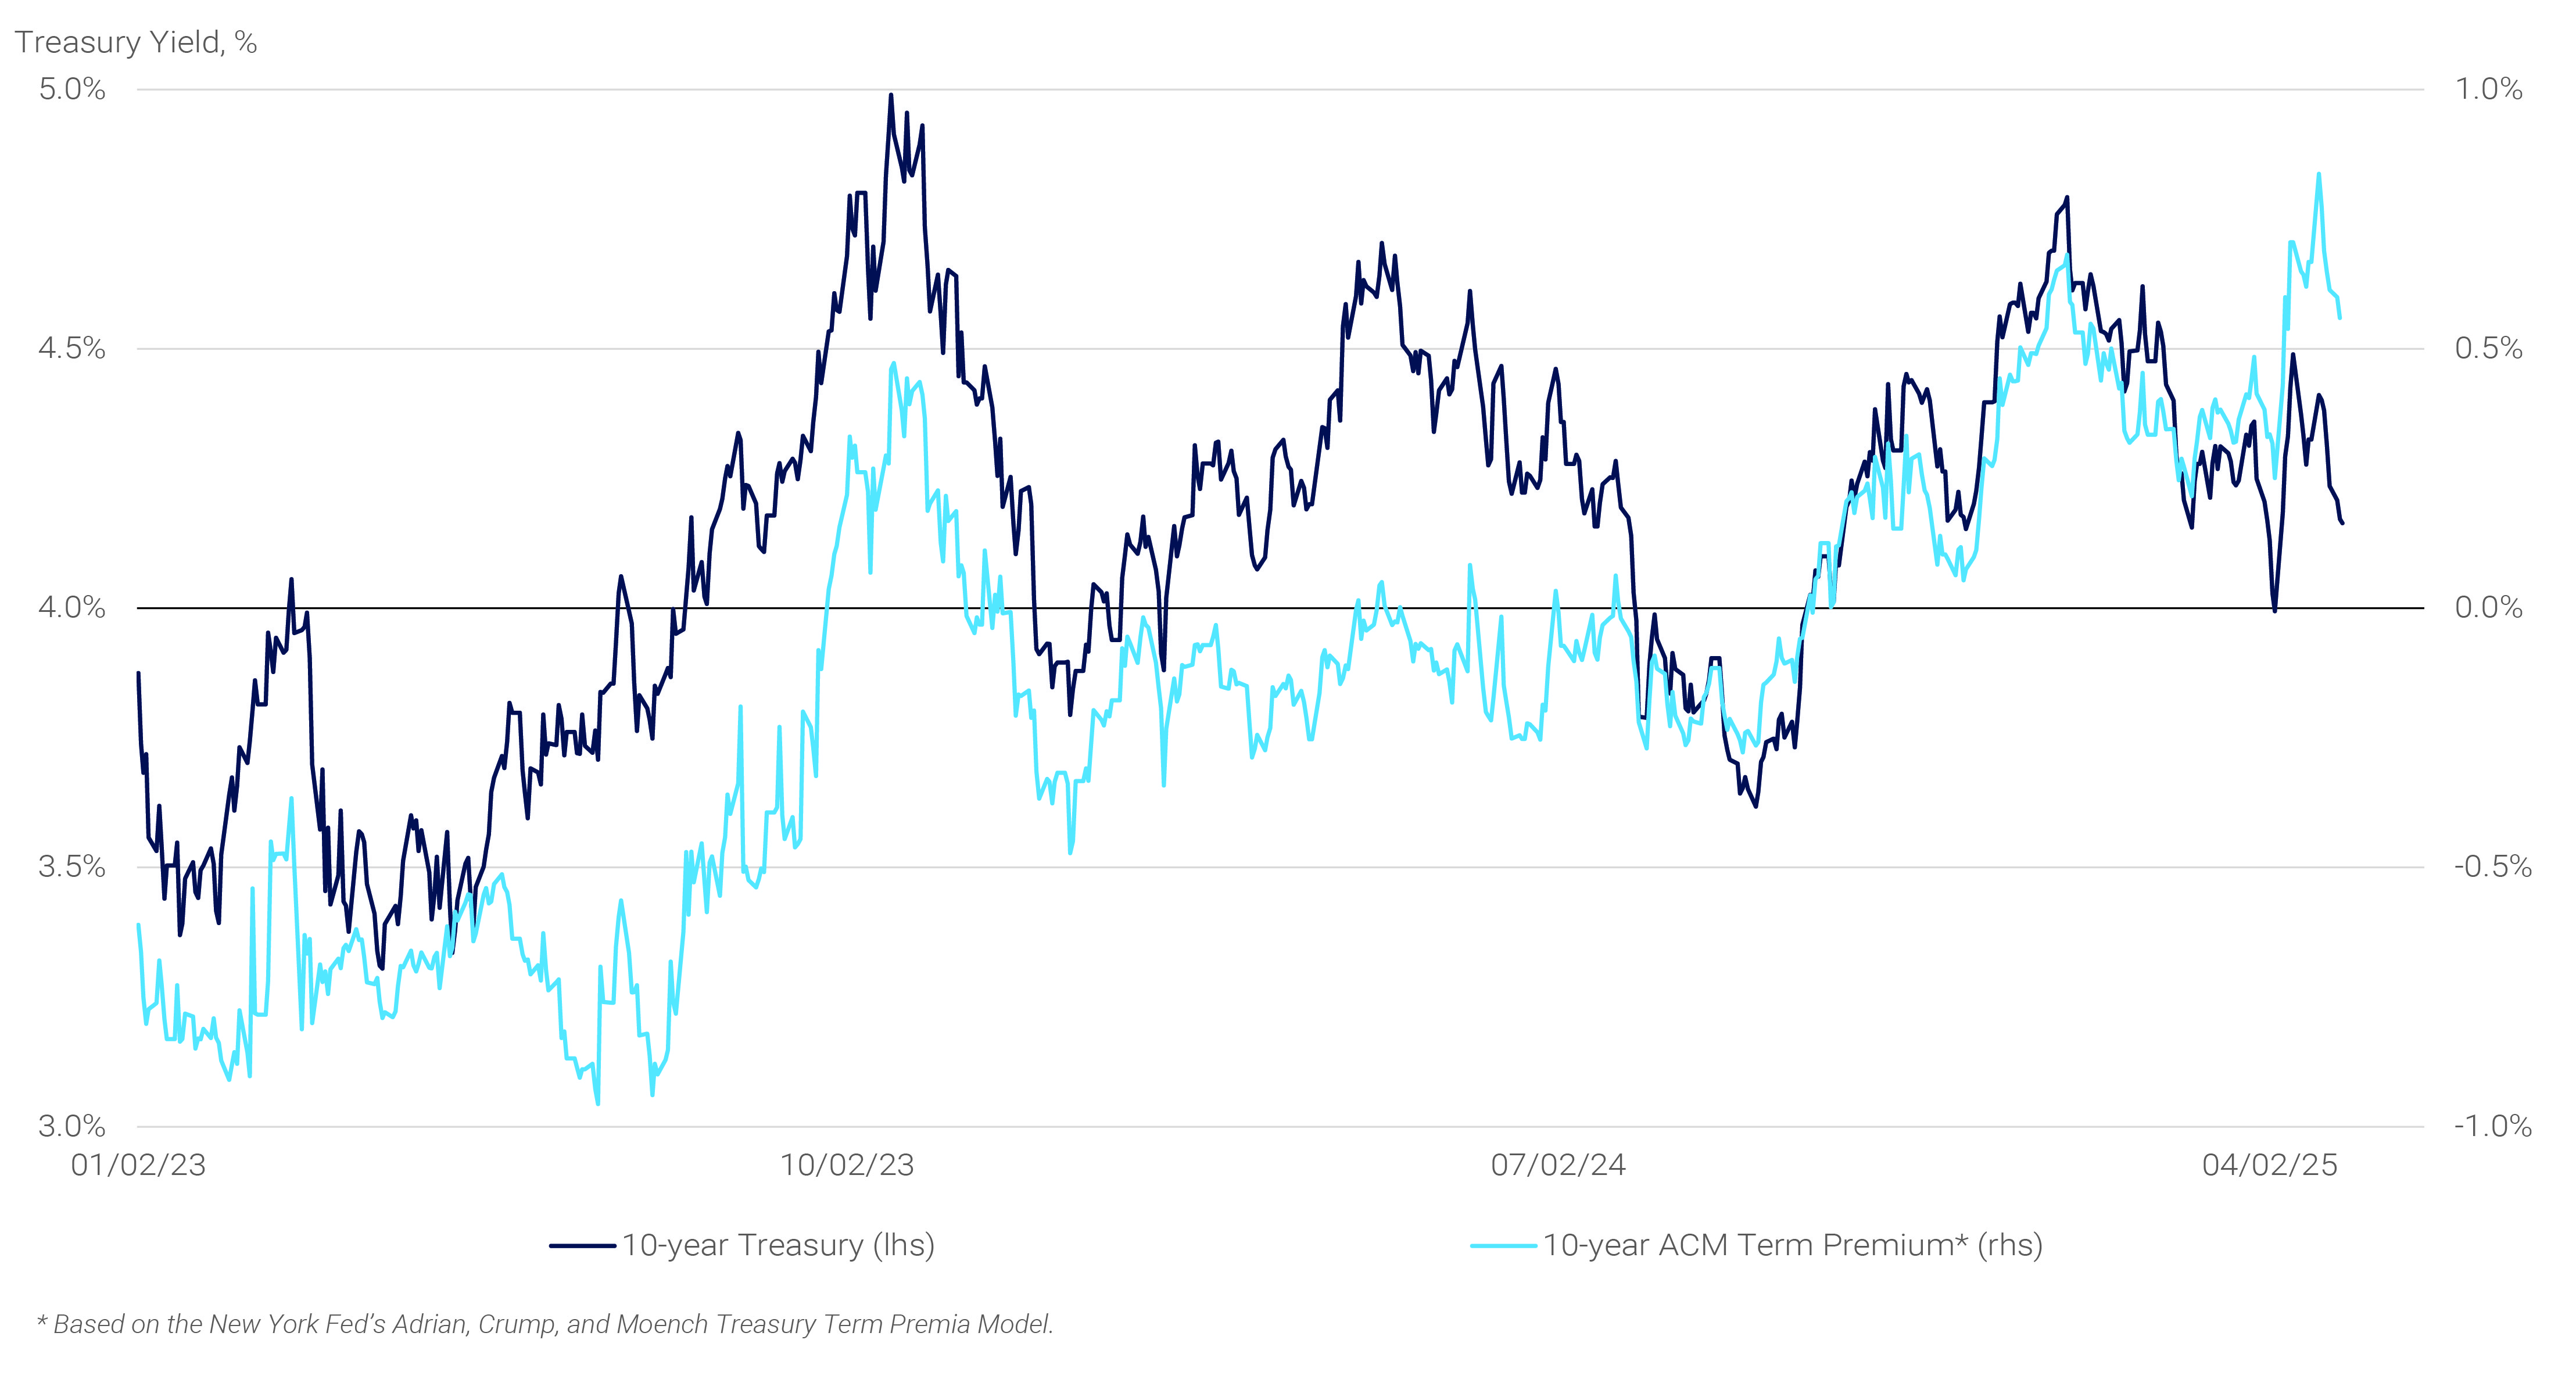
The episode highlights potential risks for Treasuries going forward, particularly as Congress readies to pass tax reform that is expected to further increase deficits in coming years. Assuming a portion of the concerns about international investors seeking alternatives to U.S. debt come to fruition, the U.S. Treasury Department would become even more reliable on price sensitive domestic money managers and the savings of U.S. households by extension. Term premium, the compensation U.S. investors require to hold Treasuries, has been rising and this trend could easily continue if large debt sales are increasingly dependent on a narrower investor base (see panel 4).
Panel 4:
Term Premium Has Been Rising
Third, and perhaps most comforting, the Administration appears sensitive to market reactions. In the week following the April 2nd announcement, the S&P 500 index fell by as much as 15%, the VIX index – the measure of expected equity market volatility – more than doubled, and bond prices plunged. In response, the Administration moved to de-escalate the trade war and has since continued with exemptions, delays, and a steady news flow about potential trade negotiations. The flexibility shown by the President and his advisors confirms that they are not indifferent to turmoil in markets.