February personal consumption expenditure (“PCE”) data did not show the anticipated full recovery from weak January consumption levels, in turn feeding the narrative that U.S. consumers are not only less confident in the economy but are also spending less. This point can be perhaps best seen in the savings rate, which rose to 4.6% in February, a 1.3 percentage points increase over the past two months. While savings as a share of disposable income remain historically low, such a sharp increase in the savings rate is rare and has generally been seen primarily in periods of meaningful exogenous changes. The Tax Cuts and Jobs Act of 2017 and the onset of the COVID-19 pandemic mark two such historical examples. Meanwhile, as consumers save more, consumption is softening and currently tracking to a -0.2% seasonally adjusted annualized growth rate (“SAAR”) in Q1, after running a quarterly average of 3.2% SAAR in 2024 (see panel 2). Real services consumption dropped on a month-over-month (“mom”) basis for the first time in more than three years led by a pronounced drop in restaurant spending (-1.7% mom). Goods consumption was stronger but ultimately failed to offset the January weather-induced weakness.(3) New car purchases rose sharply in February and March, with the latter based on car sales estimates, as consumers tried to front-run tariffs.
Panel 2:
Consumption Much Weaker to Start 2025
It should be noted that the slower consumption rate appears largely due to a crisis of confidence rather than a significant deterioration in consumer finances. Personal income growth remained strong in February, and household balance sheet data published by the Fed showed no major decline in Q4. However, recent stock market performance could have raised caution among consumers. For now, the question for the broader economy therefore is when consumers can regain their confidence, a smaller ask than when they can regain their jobs and incomes.
In addition to weaker spending, meaningful front-running of tariffs in international trade appears to be weighing on current quarter growth estimates as well. Trade data for January and February suggests U.S. imports have run at record levels, as U.S. manufactures increased imports of goods, while exports remained relatively unchanged. Inventory data released thus far does not show an offsetting boost to GDP growth calculations, suggesting that Q1 GDP will see a negative impact from the larger trade deficit, even if a significant portion of the imports are driven by non-monetary gold imports.
Inflation and Monetary Policy
On the inflation front, February data surprised a bit to the upside. The Core PCE Price Index gained 0.4% mom, lifting the year-over-year (“yoy”) rate to 2.8%. While core inflation is still lower than it was throughout most of the past two years, this uptick highlights the challenge facing the Fed as monthly price gains were broad across both goods and services. Goods inflation has picked up in recent months even though most of the Administration’s planned tariffs have not yet taken full effect. Even if tariff-related price pressures are thought to produce a one-time price jump, rather than sustained price increases, the odds of inflation measures continuing to make progress towards the Fed’s 2% inflation target have declined for 2025. This risks a second consecutive year in which PCE inflation remains stuck around 3%.
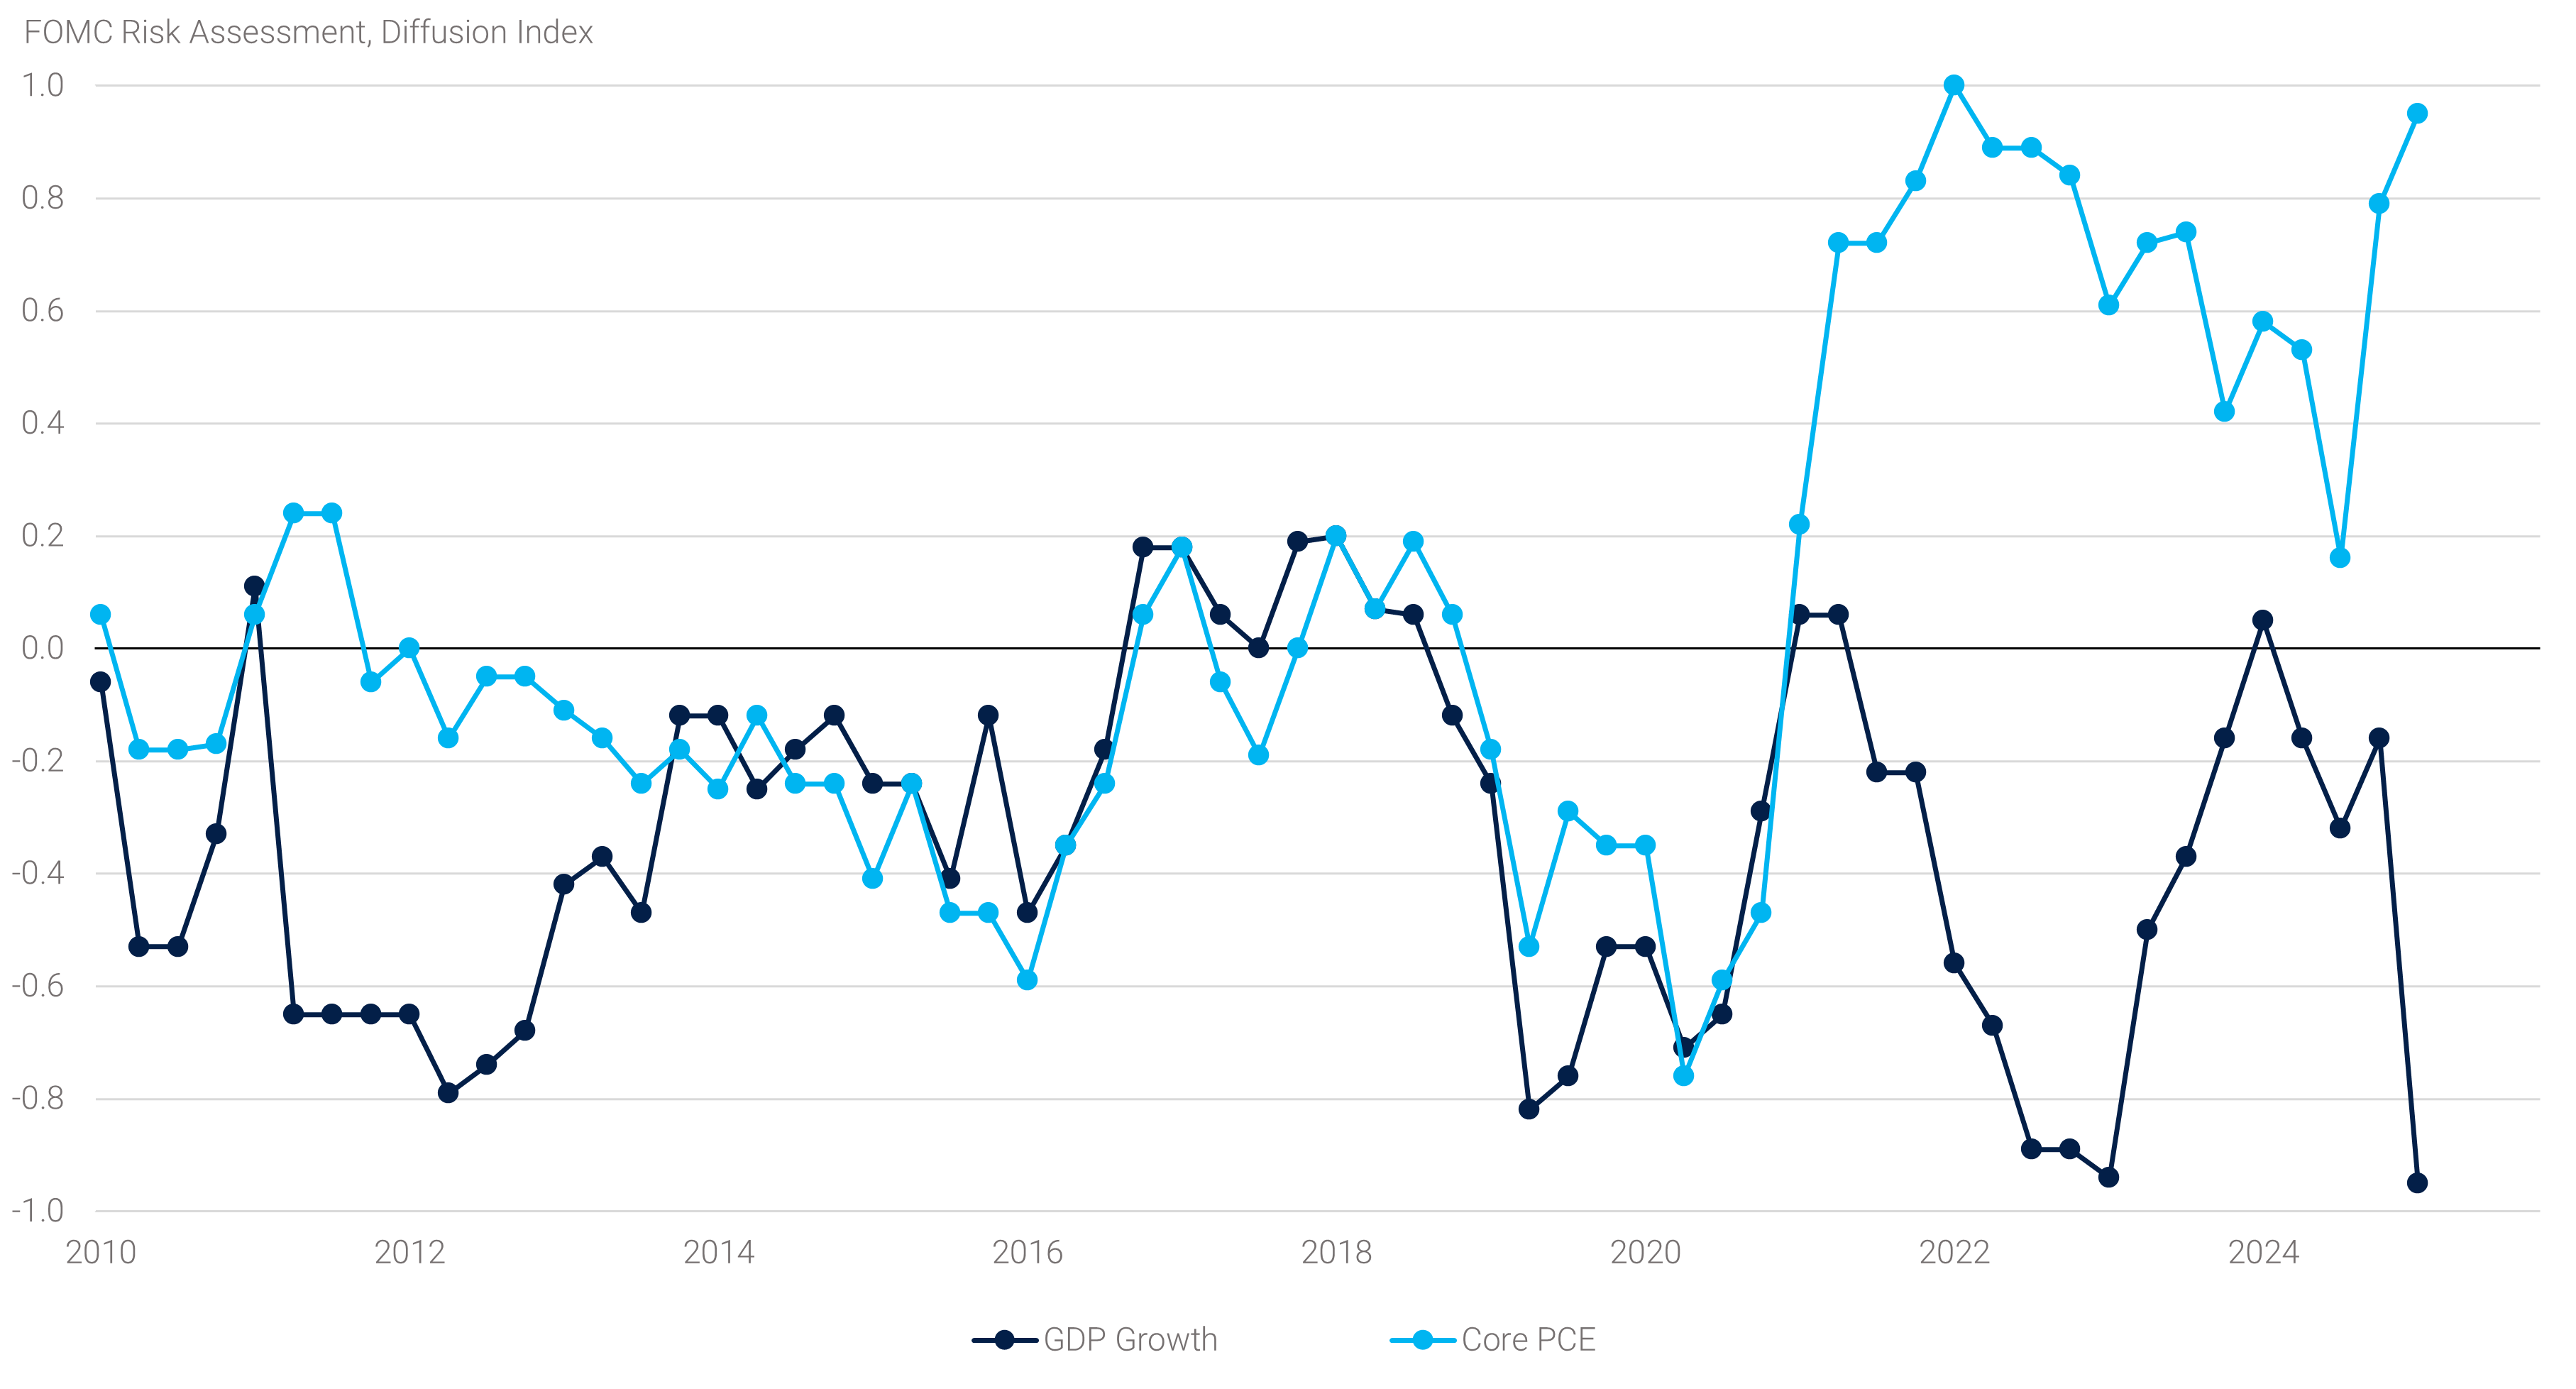
In light of the lack of progress on inflation along with heightened uncertainty on growth, Fed policymakers have opted for a more cautious tone in their view of the economy. Notably, prior language that suggested the Federal Open Market Committee’s (“FOMC”) employment and inflation objectives were roughly in balance was updated to highlight increased “uncertainty around the economic outlook” at their March meeting. The release of the updated economic forecast reflected widely expected near-term adjustments. Specifically, the median 2025 GDP growth forecast was downgraded to 1.7% and the 2025 core PCE inflation forecast was revised upwards to 2.8%. Moreover, when assessing their economic projections, most FOMC members see an upside risk to the PCE forecasts and a downside risk to their economic growth forecast, thereby highlighting the undesirable economic outcome of the 1970s: stagflation (see panel 3).(4)
Panel 3:
Fed Officials Worry About Stagflation
Labor Market
Despite fading optimism, the labor market appears to be holding up for now. The U.S. economy added 151,000 jobs in February and revisions to prior months' data were minimal according to the Bureau of Labor Statistics report. The report showed broad private sector hiring across industries, though a handful of sectors saw employment decline, including restaurants, retail trade, and the federal government, including the U.S. Postal Service. Notably, the roughly 7,000 drop in federal government employment marked the largest monthly decline since June 2022. However, that decline was more than offset by gains in state and local government employment.
February’s hiring data was accompanied by some tentative signs of labor market softness in the household survey. The unemployment rate rose 10 basis points (“bps”) to 4.1% despite a 20 bps decline in the labor force participation rate (to 62.4%), suggesting rising unemployment despite fewer people in the labor force. The somewhat contradictory signs from hiring and the household survey will have to be monitored going forward, as the significant reduction in immigration is expected to impact the labor market in coming months. With fewer immigrants entering the labor force, hiring could run at lower rates to maintain stable unemployment rates. That said, this offers little insight about labor demand, which factors most prominently into developments in the unemployment rate.
Financial Markets
Interest Rates, Volatility, and Monetary Policy
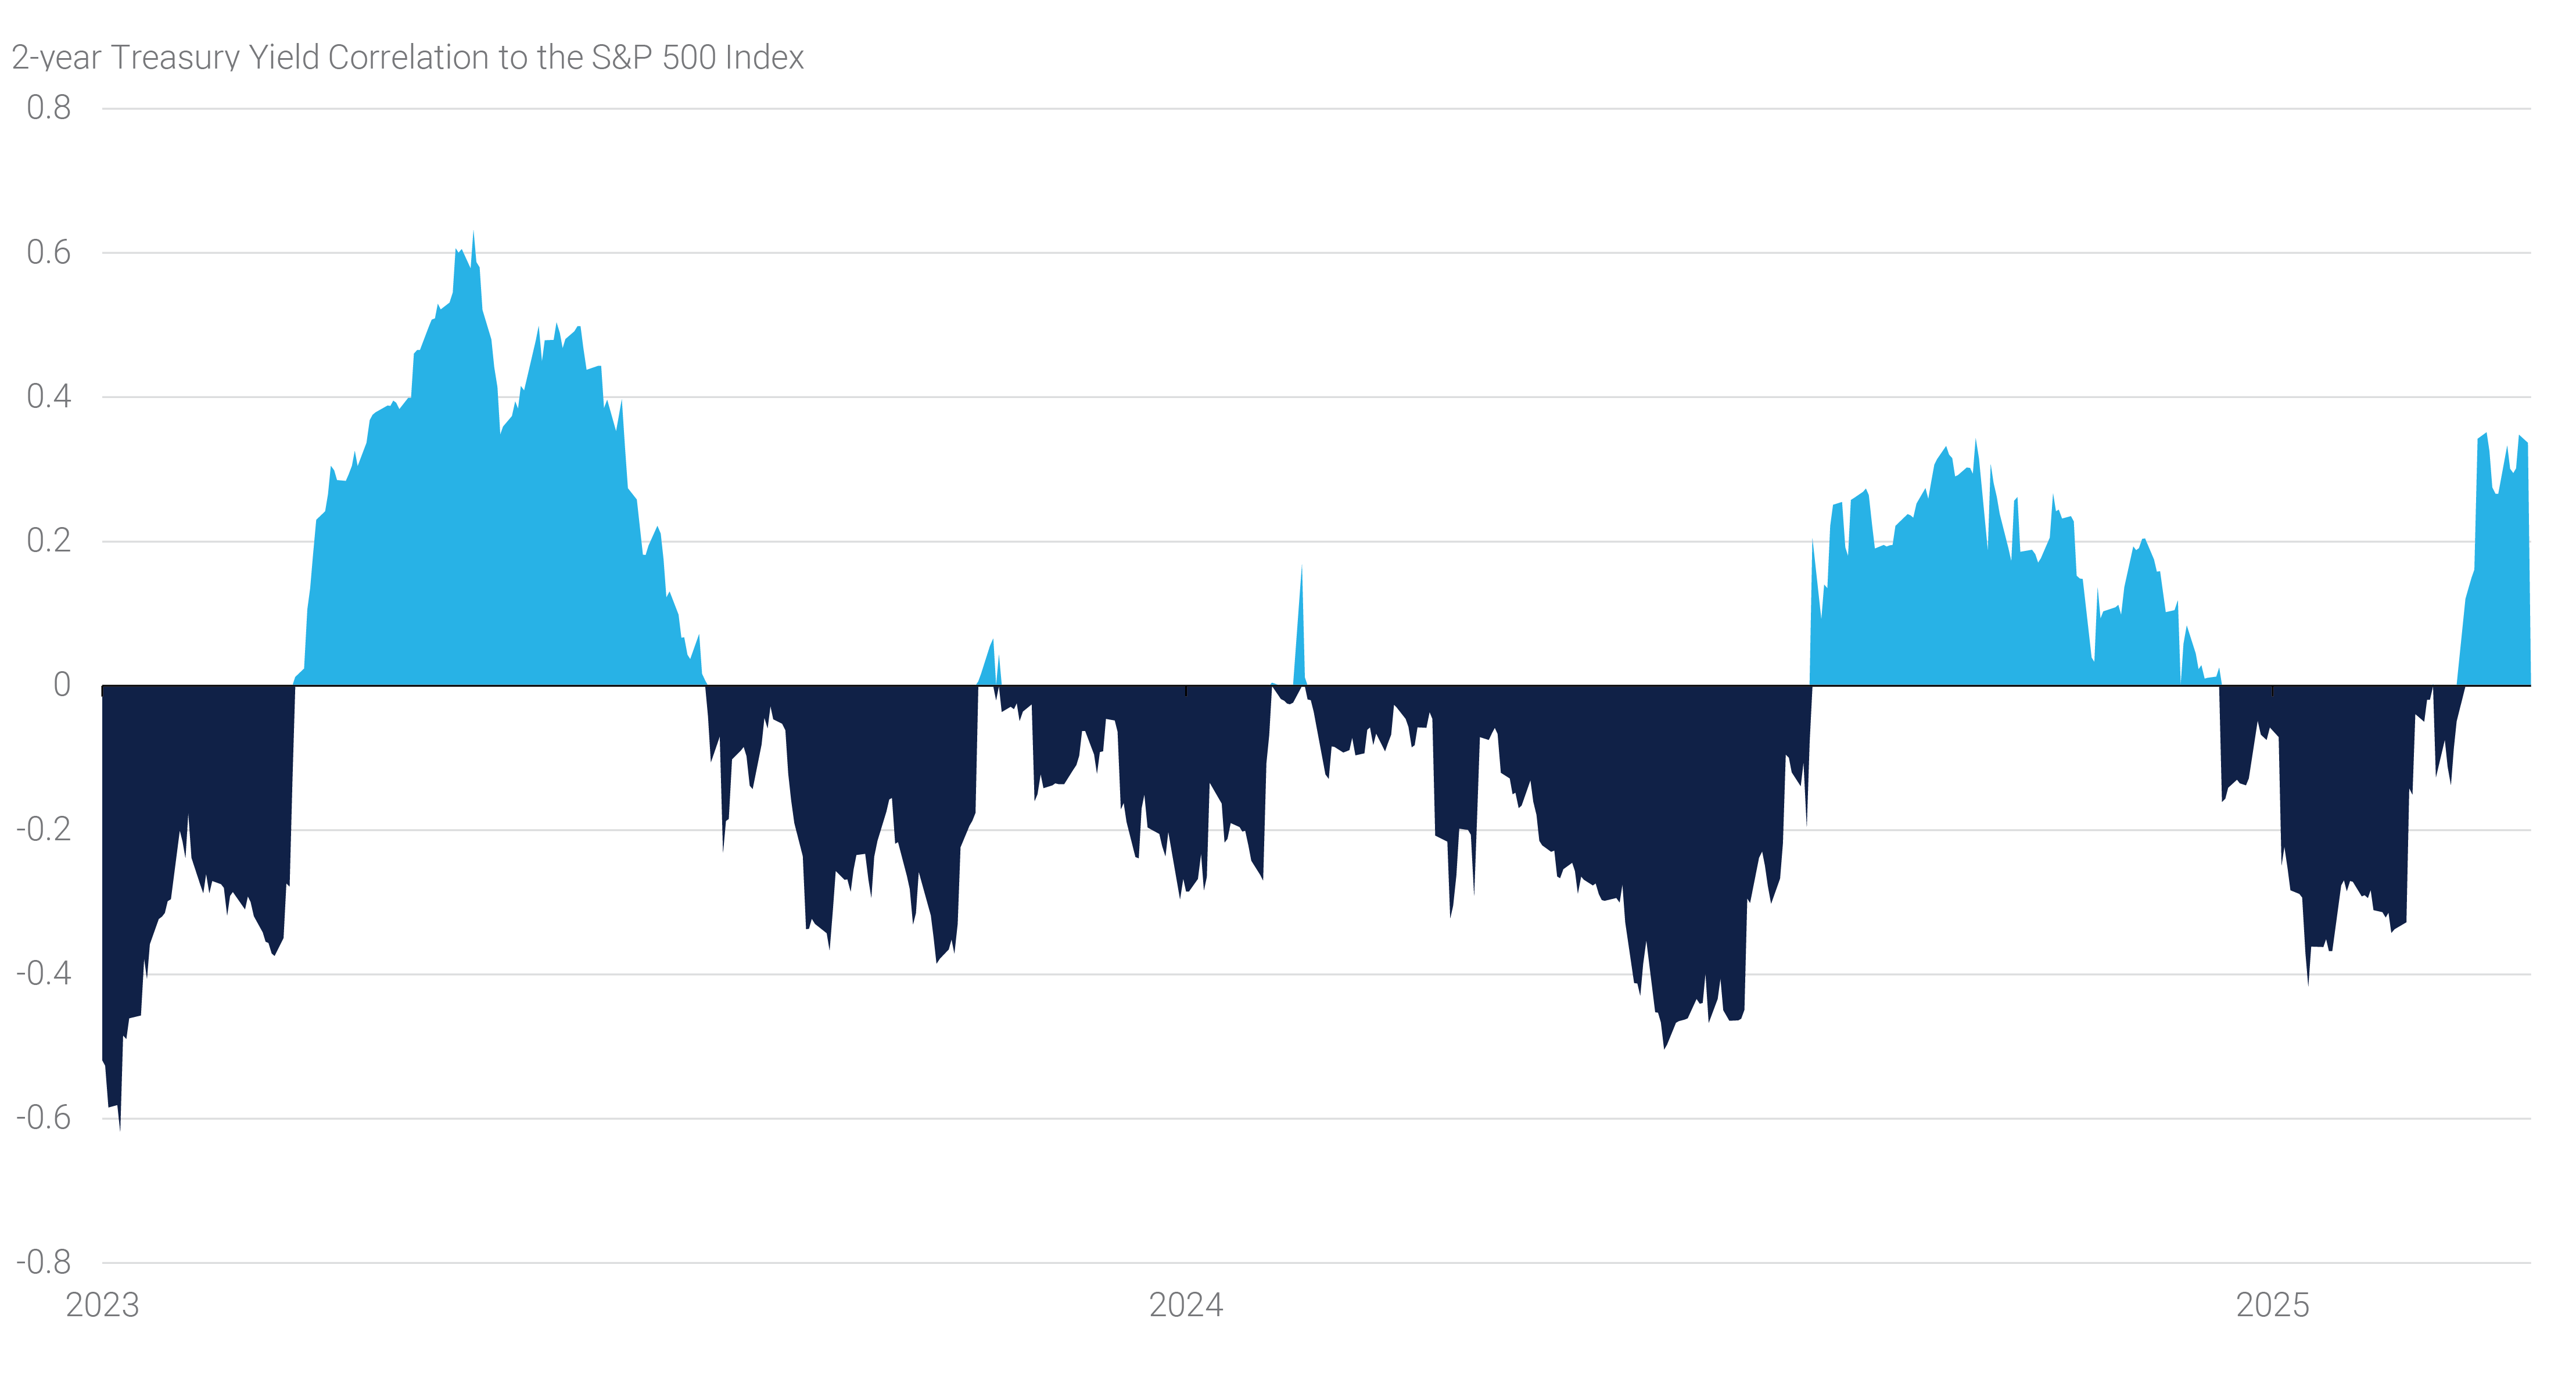
Despite March’s macroeconomic fireworks, interest rate markets were generally less volatile than risk assets and less volatile than in prior months. For example, 5-year Treasury yields traded in a 26 bps range in March, compared to a 50 bps and 33 bps range in February and January, respectively. This helped lower swaption-implied interest rate volatility, although yields shifted at different points along the curve. At the mid-month FOMC meeting, Fed Chair Powell downplayed the near-term rise in inflation expectations and highlighted growing uncertainty around economic growth, prompting the market to price in a higher likelihood of Fed rate cuts later in the year. By month-end, overnight index swaps priced expectations for 75 bps of Fed easing, or three rate cuts over the next nine months. Option-implied probabilities on December 2025 SOFR Futures showed one-in-three odds of the Fed cutting 100 bps or more this year, which also helped 2-year Treasury yields to end the month 11 bps lower at 3.88%. Of note, correlations between front-end Treasury yields and the S&P 500 turned positive once again in early March, as investors sought to buy fixed income into signs of economic weakness and weaker risk assets (see panel 4).
Panel 4:
The Correlation Between Rates and Risk Assets Has Reversed Again
Meanwhile, fiscal policy uncertainty and higher inflation expectations led investors to demand higher yields for holding long-term Treasury bonds, pushing 30-year Treasury yields up by 8 bps. Against this backdrop, the Treasury curve steepened to its highest levels since the Fed began its tightening cycle. At 65 bps, the spread between the 5-year and 30-year Treasury yields reached its widest level since the first week of 2022.
At its recent meeting, the FOMC also announced a change to its balance sheet policy, slowing the pace of its security redemptions from a maximum of $60 billion to $40 billion per month starting in April. Actual redemptions continue to run well below the caps, as MBS maturities are less than half of their $35 billion monthly cap. Unlike the potential temporary adjustment mentioned in the January FOMC meeting minutes, which was related to debt ceiling uncertainties, this change is permanent and intended to ease potential debt ceiling volatility and maintain a smooth adjustment to liquidity conditions even while the balance sheet normalization process continues. It also implies that the balance sheet runoff is likely to occur for a longer period, albeit at a much slower rate.
Agency MBS and Credit
Amid the risk-off market environment in March, Agency MBS spreads widened modestly, with the Bloomberg U.S. Mortgage-Backed Security Index recording a negative 27 bps excess return. A decline in demand from money managers, coupled with a seasonal increase in origination volumes, led mortgage spreads to decouple from the decline in rate volatility in March.
Similarly, credit spreads widened as risk sentiment declined and supply remained elevated due to heavy maturities. The first quarter set a record for quarterly corporate investment grade issuance, excluding the second quarter of 2020 which experienced pandemic-related anomalies. Excess returns on the Bloomberg U.S. Aggregate Corporate Bond Index were negative at -42 bps.
Equities and Commodities
The most pronounced risk-off move occurred in the equity market. Trade policy related uncertainty has highlighted headwinds to broader economic activity and drove investors away from consumer-related and high-growth stocks. The tech-heavy Nasdaq 100 index fell 7.7% in March with megacap stocks bearing the brunt of the selling. The S&P 500 index fell 5.8%, its worse monthly performance since September 2022. The stock market sell-off so far this year has wiped out the investor optimism that was priced in after President Trump’s election win last fall.
The flight-to-quality move led to a rally in safe-haven commodities. The price of gold hit another record high in March, ending the month above $3,100 per ounce and now up over 19% year to date. Crude oil also rose, with West Texas Intermediate crude oil up 2.5% in the month.