Key Findings
- The U.S. economy ended 2024 on a strong note, but it appears that uncertainty created by certain early actions of the Trump administration have undermined some of the growth momentum. While economists are waiting for economic data to judge the extent of the potential slowdown, waning consumer confidence and unusually cold weather appear to have slowed spending at the beginning of 2025.
- Financial markets took note of declining consumer confidence and increased uncertainty stemming primarily from the administration’s rapid changes in a number of areas, including trade and tariff policy as well as federal government employment.
- The release of the January Federal Open Market Committee (“FOMC”) meeting minutes highlighted that Federal Reserve (“Fed”) officials are attentive to the end of quantitative tightening (“QT”), despite more dismissive signals from Fed Chair Powell in the post-meeting press conference. We discuss the state of play on QT, which is further complicated by upcoming volatility in the Treasury’s bank account, and why the Fed should consider an earlier end to QT in the current environment.
The U.S. Economy
Economic Growth and Inflation
Economic data received in February confirmed the strength of the U.S. economy and noted that inflation remained sticky at the end of 2024. The change in Q4 gross domestic product (“GDP”) was unrevised at 2.3% seasonally adjusted annualized growth rate (“SAAR”) driven by resilient consumer spending. However, the outlook for 2025 has turned cloudier given the weakness in January consumer spending, which was partially attributable to fading consumer confidence. Meanwhile, early estimates of record monthly imports in an apparent front-running of potential tariffs leveled against major trading partners such as Mexico and Canada appear to skew economic growth data. As of the end of February, the Atlanta Fed’s GDPNow model estimates that Q1 GDP growth is running at -1.5% SAAR, driven primarily by a record goods trade deficit in January.
Consumers tightened their belts in January with the Personal Consumption Expenditure (“PCE”) report showing -0.2% month-over-month (“mom”) nominal consumption growth on a downshift in durable goods consumption, which fell particularly for new- and used cars. Service sector spending held better than goods spending, particularly considering that consumers showed healthy restaurant spending during the coldest January in nearly 40 years. Despite the slowdown, consumer fundamentals remain solid with households in broadly good financial shape as income growth is still supportive of a constructive consumption pace. The big question, then, is how long the consumer chooses to remain cautious.
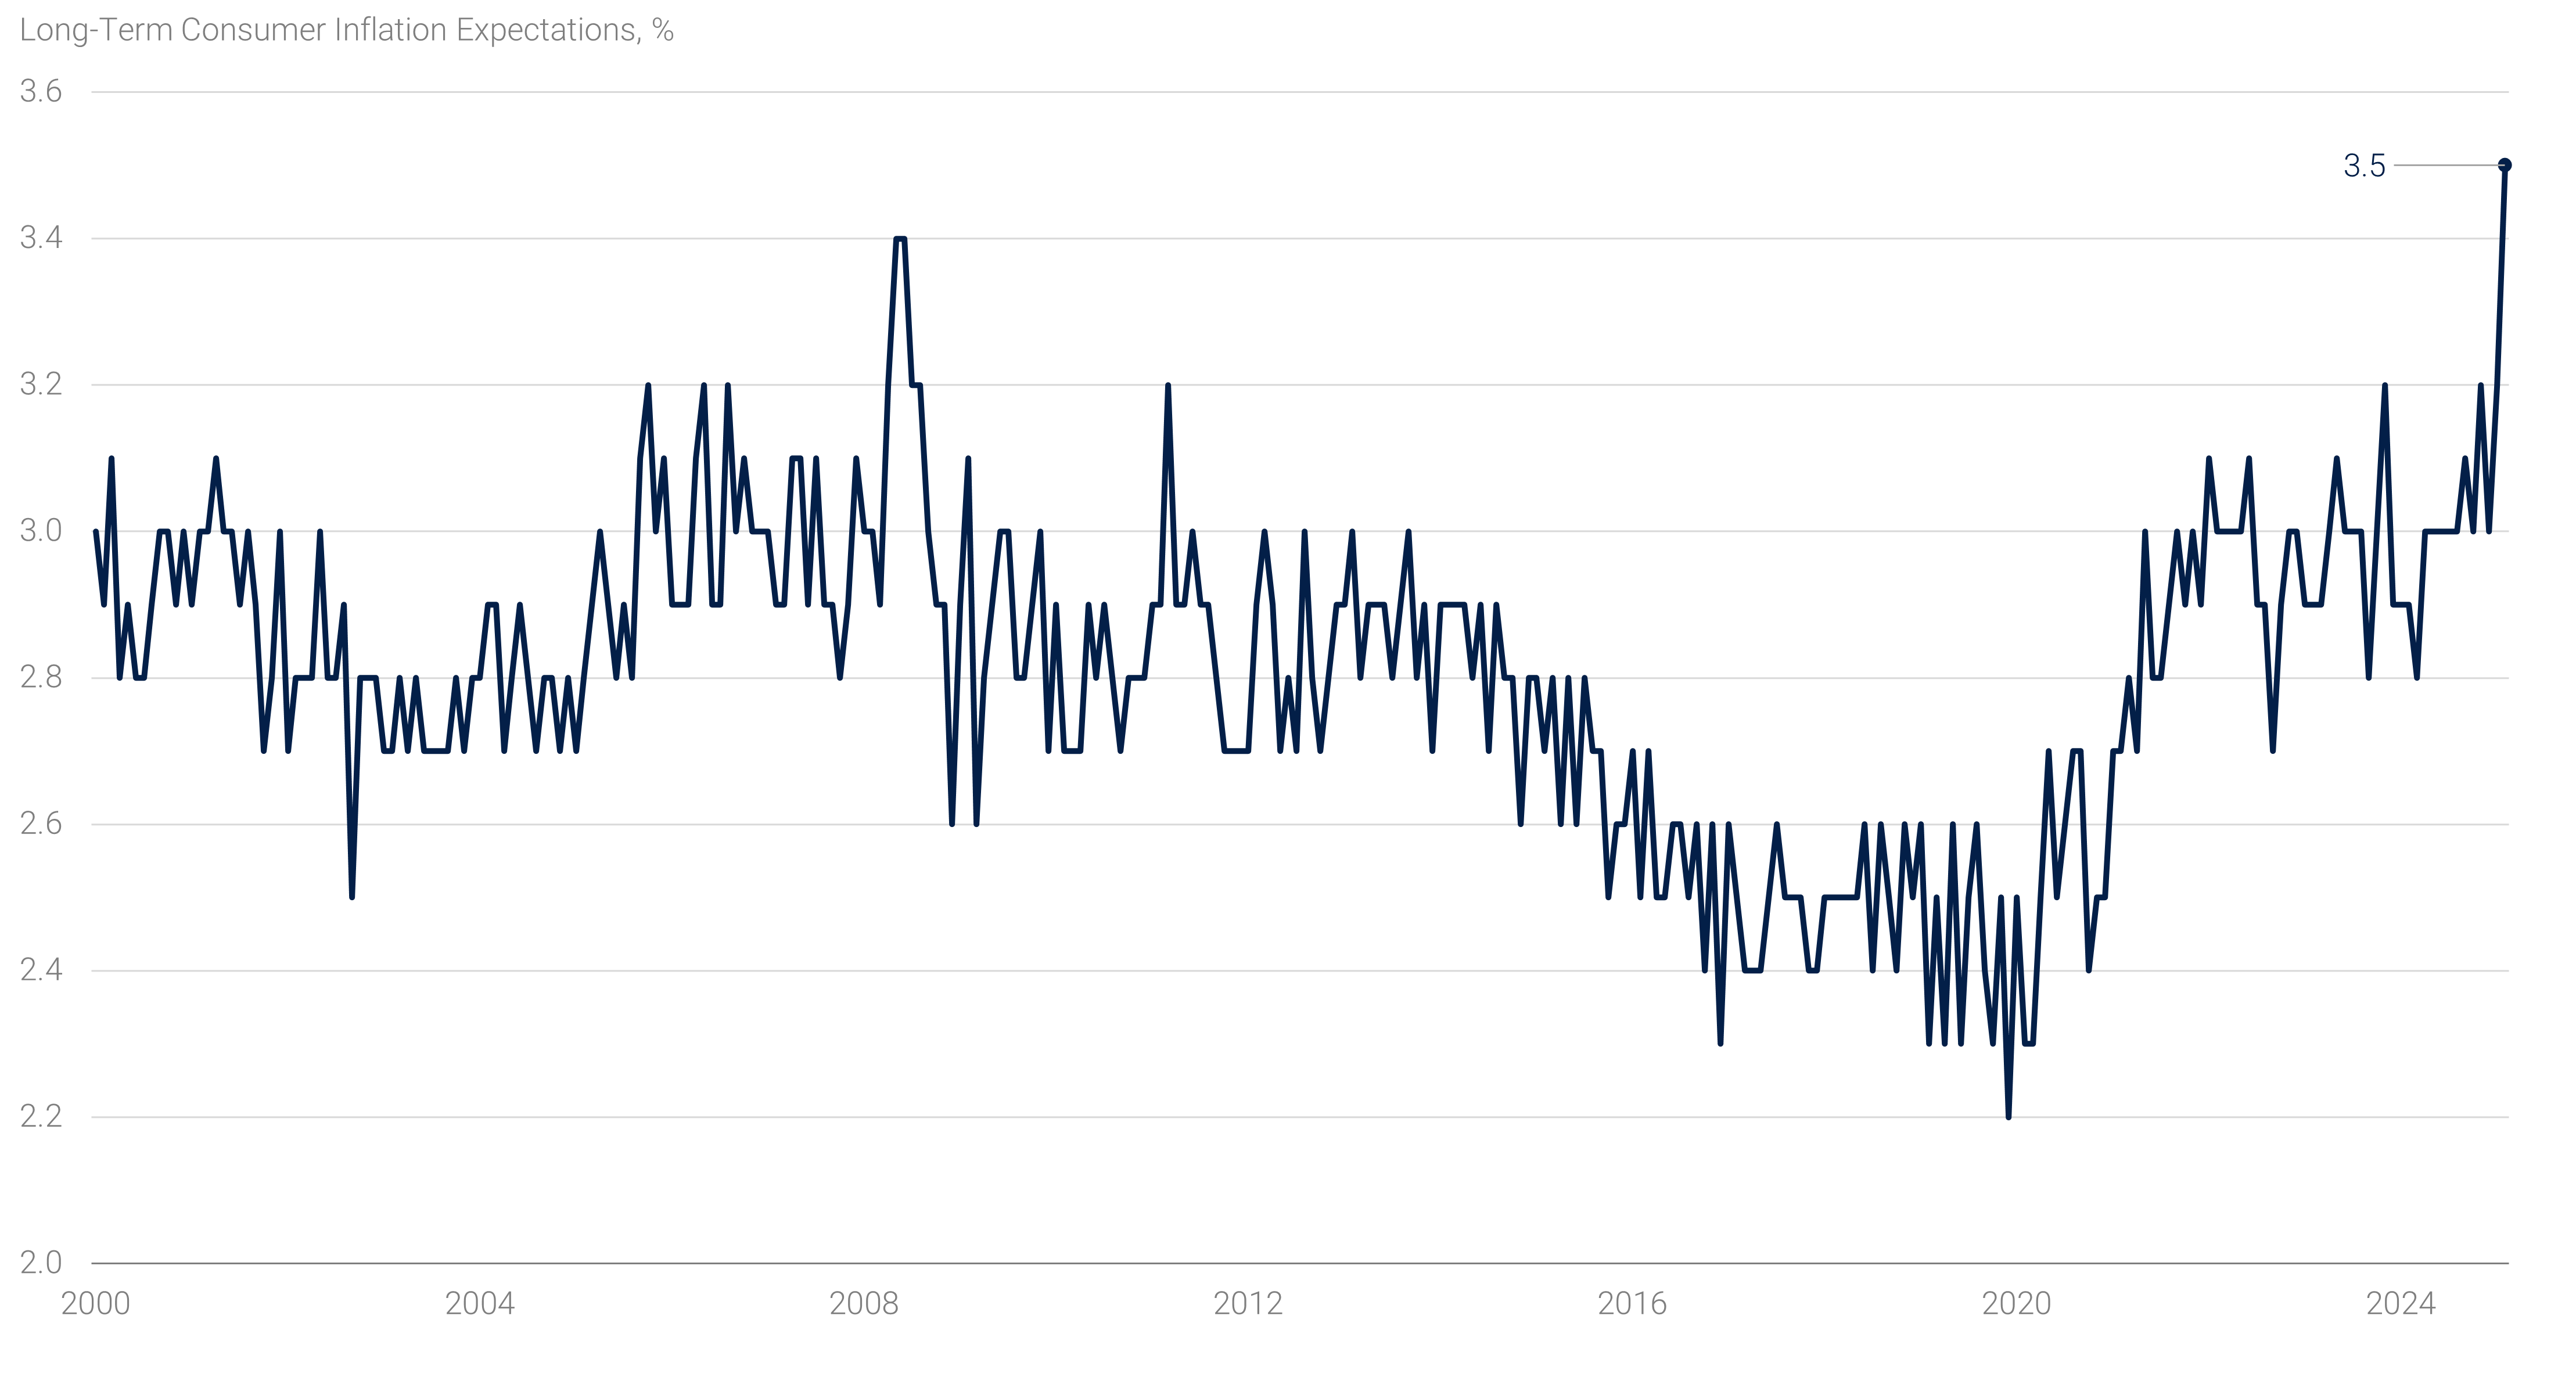
Economic survey data suggested consumers might stay cautious for now given the changing policy landscape in Washington. The University of Michigan and Conference Board's measures of consumer confidence fell in January with the latter noting that consumers are apprehensive given the trade and tariff backdrop.(1) Nonetheless, consumers’ jitters were perhaps most evident in the spike in short-term and long-term inflation expectations, with the former rising by a full percentage point and the latter reaching the highest point since the 1990s (see panel 1). In addition, the prices paid component of both the ISM manufacturing and services ISM surveys also pointed to widespread pricing pressures.
Despite rising survey-based inflation expectations, inflation hard data generally showed smaller January increases than in years past, signaling that outside what is widely viewed as a one-time price level adjustment from tariffs, inflation continues to gradually normalize. The headline PCE price index slowed to 2.51% year-over-year (“yoy”) in January, while the core PCE index slowed to 2.65% yoy. Despite the modest progress, pricing pressures remain widely apparent particularly in services outside of housing. Prices in these categories remain well above pre-pandemic averages and have shown little signs of a more meaningful slowdown.
Panel 1:
Policy Uncertainty Leads to Rise in Consumer Inflation Expectations
Labor Market
According to the Bureau of Labor Statistics (“BLS”), the labor market gained 143,000 jobs in January, a read modestly below expectations. However, strong upward revisions, which added 100,000 jobs to the prior two months, combined with a decline in the unemployment rate to an 8-month low of 4.0% show that the labor market remained on solid footing.
The January release included annual revisions to the establishment survey's employment figures. Although smaller than the preliminary estimate, the annual benchmarking included the largest downward revision since 2009, lowering the average monthly gain in payrolls through March 2024 by nearly 50,000 jobs. Post March 2024 revisions left the employment picture broadly unchanged, with slower growth in the summer months offset by faster payroll growth at the end of the year. The household survey also included its annual update to the population controls that are used to weight the survey sample. Using Census estimates, the BLS increased the population estimate by 2.8 million people, including 2.1 million in the labor force, and 2.0 million being employed. In turn, these updates modestly improved the labor force participation rate and lowered the unemployment rate. Of note, the downward revision to payrolls and lift to the level of household employment helped narrow the gap between the two surveys' indications of employment growth over the past year. The report also showed that the large immigration-led influx was well absorbed by the labor market and likely helped achieve a better balance between labor supply and demand.
Financial Markets
Interest Rates and Volatility
Treasury yields ended the month of February in anticipation of hard economic data confirming what survey data appears to be suggesting: a slowdown from the strong pace of growth in 2024 is underway. As a result, the 10-year Treasury yield rallied 33 basis points (“bps”), in turn flattening the yield curve. Much of the move was driven by real yields, as investor risk sentiment shifted towards the safe haven of Treasuries. Interest rate volatility is generally little changed mom, though it declined more meaningfully in the middle of February before rising again in the second half of the month.
Of note, front-end yields moved less than long end yields, driven by Fed officials’ steadfast messaging that the central bank will take more time to assess economic data before lowering its target rate further. As of the end of February, overnight index swaps priced 68 bps in aggregate cuts by December 2025 – equivalent to more than two 25 bps cuts – slightly higher than the 48 bps priced at the end of January.
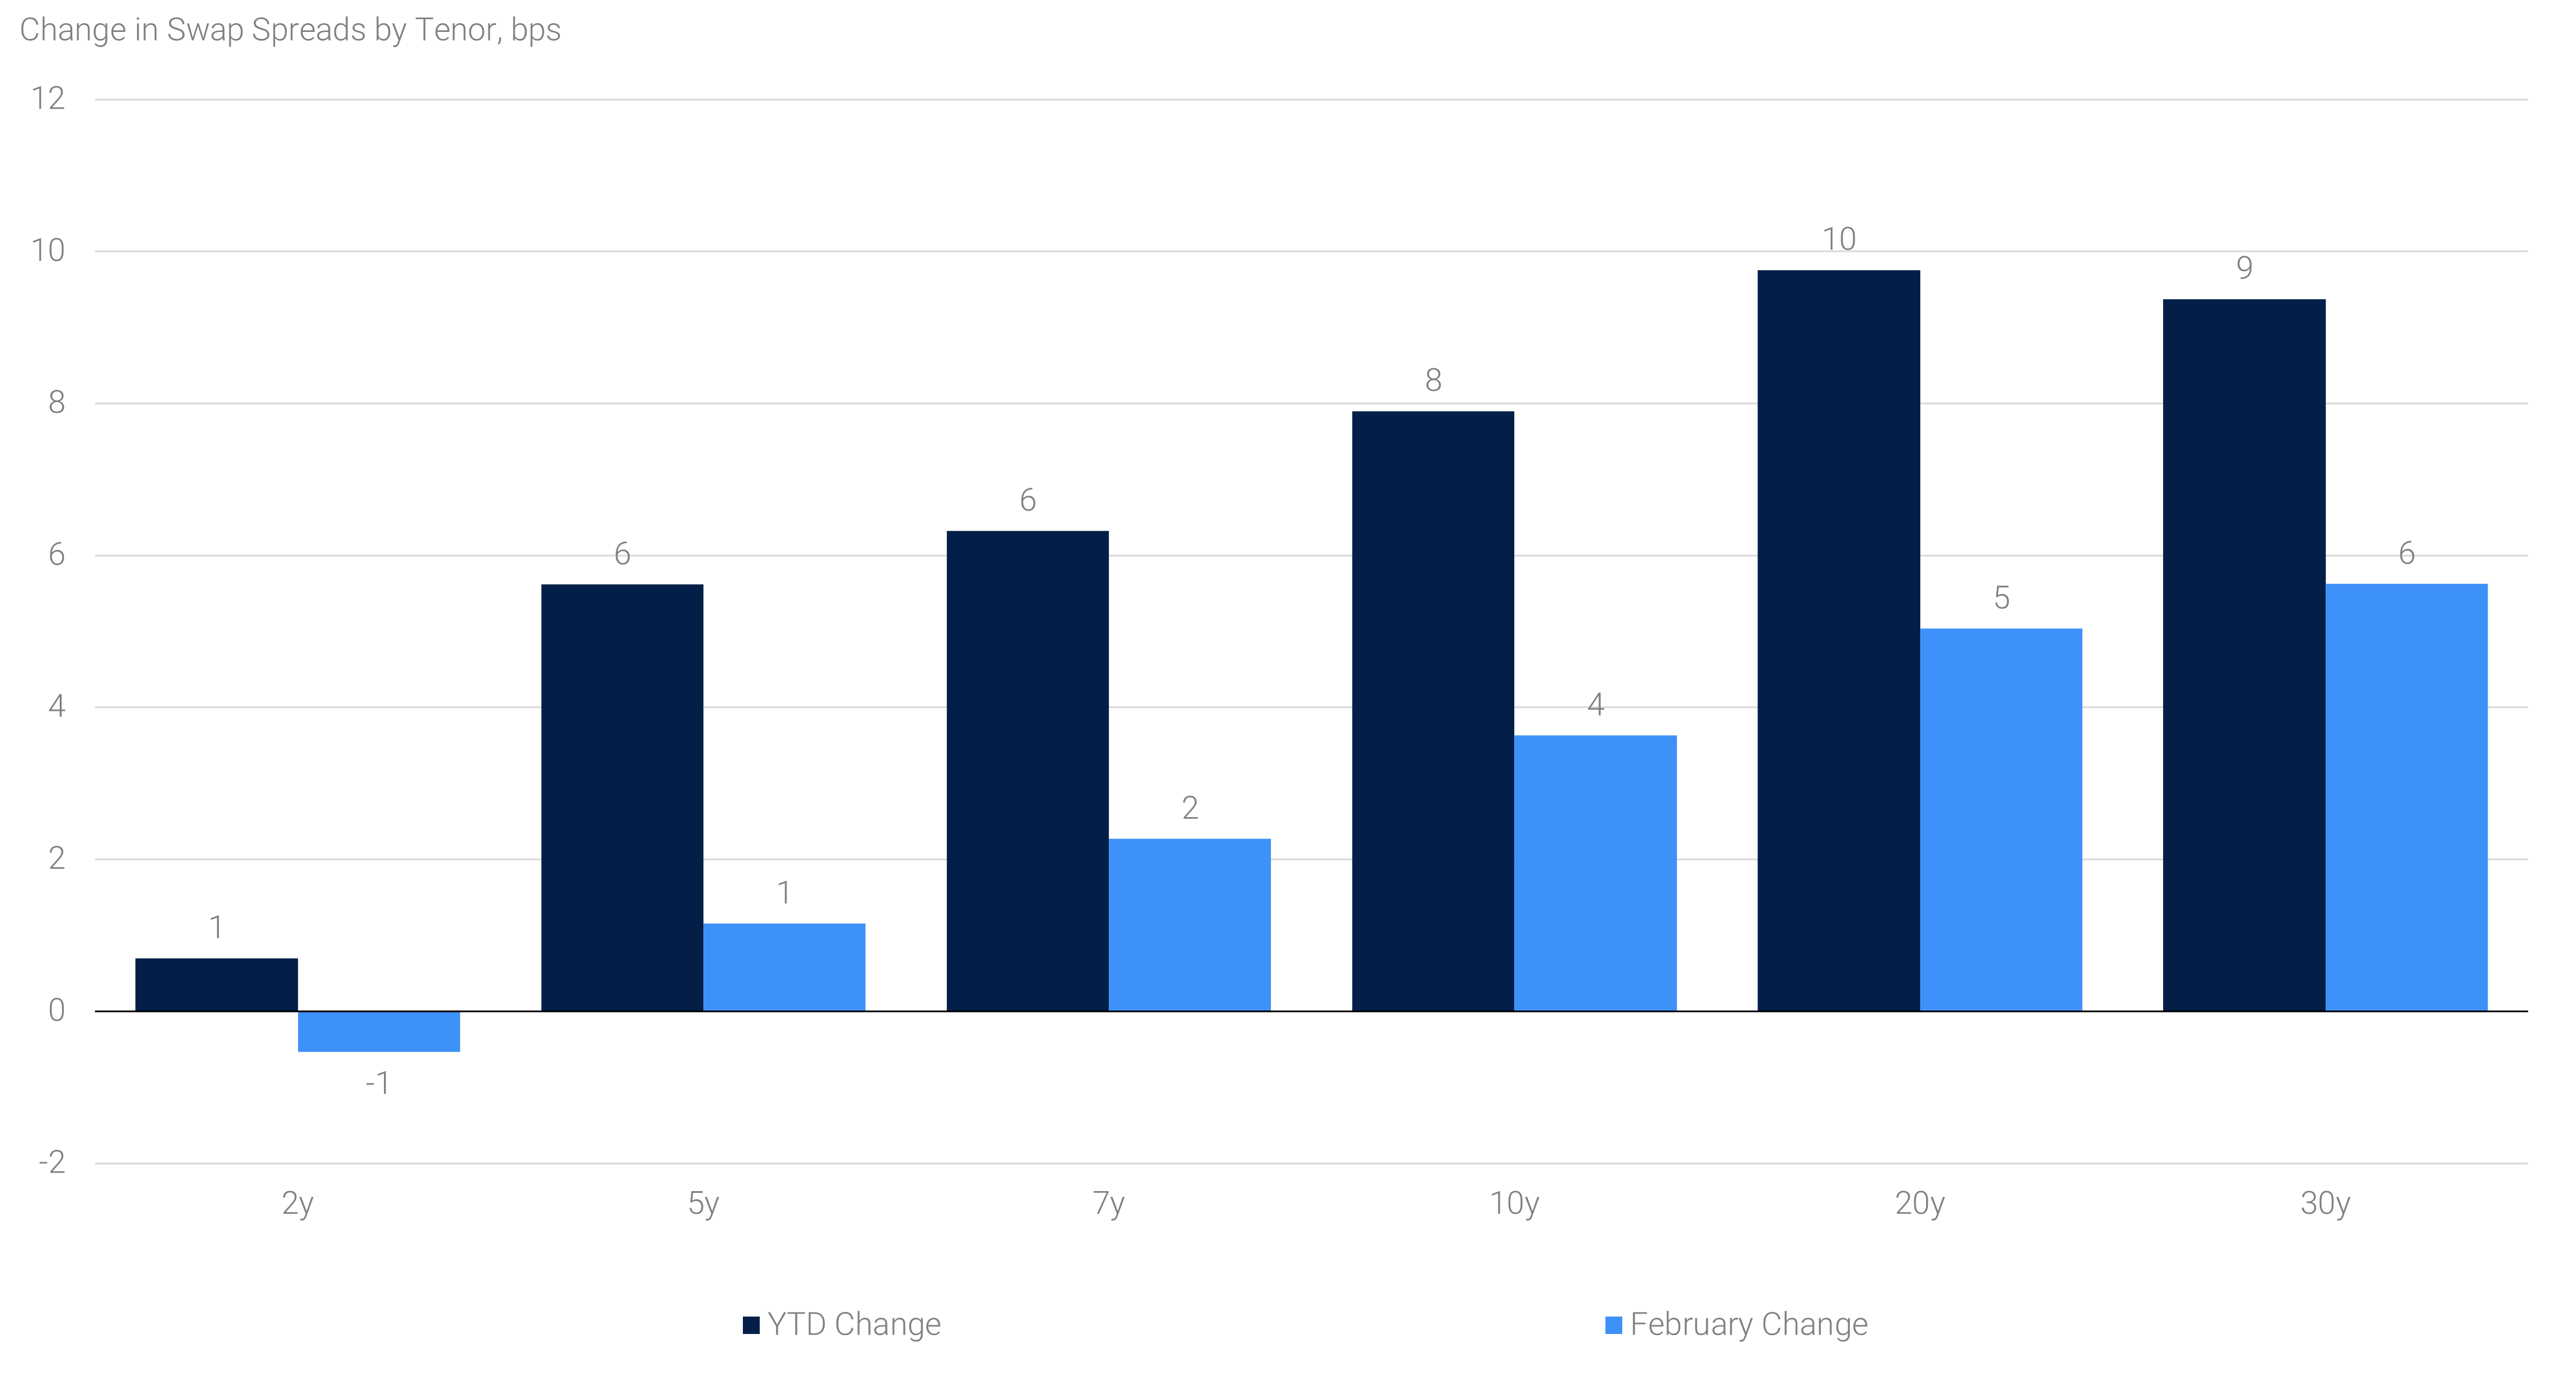
The most notable price action in the month might have come in swap spreads, as the difference between Treasury and corresponding swap rates increased by up to 6 bps in the 30-year tenor in February (see panel 2). The wider swap spreads were driven by potential regulatory changes, as key Fed speakers, including Fed Chair Powell during his semiannual Congressional testimony, suggested regulators are looking at changes to banks’ supplementary leverage ratio for Treasuries and reserves. Easier rules could help to ultimately free up bank balance sheets for low margin business activities such as trading Treasuries and improve liquidity in the market in turn.
Panel 2:
Swap Spreads Widened on Regulatory Optimism
Agency MBS and Credit
Current coupon MBS spreads tightened in February, helping the Bloomberg U.S. Mortgage-Backed Security Index record a 16 bps excess return, the best monthly performance since November. In addition to healthy demand, supply is expected to run below historical averages in 2025, in part because housing turnover appears to remain subdued.
Credit spreads are relatively unchanged on the month as measured by the CDX Investment Grade Index, though excess returns on the Bloomberg U.S. Aggregate Corporate Bond Index were negative at -55 bps. Corporate bond supply reportedly continues to run at elevated levels, with total monthly issuance coming in slightly below earlier estimates but nonetheless at the second highest February level on record.
Equities and Currencies
U.S. equities underperformed in February, with the S&P 500 Index falling 1.4%. The decline was driven by factors similar to those affecting interest rate markets, particularly the market’s realization that the Trump administration’s proposed changes to the international trade and tariff system will be at least temporarily costly. Notably, the corporate earnings season looked robust once again, with companies reporting healthy earnings growth and the highest operating margins since 2021.
Currency and commodity markets also witnessed meaningful cross currents in February. The U.S. Dollar Index ended modestly weaker, having declined 0.7% on the month, though individual currency pairs were highly volatile. The Japanese Yen was the strongest major performer relative to the U.S. Dollar, while the Canadian Dollar strengthened from its weakest levels in nearly a decade as tariff threats were delayed early in the month, only to reverse a portion of the strength on renewed tariff threats in the latter part of February.
Navigating the End of Quantitative Tightening
Since June 2022, the Fed has reduced its securities portfolio holdings by $2.1 trillion, shrinking its balance sheet more than three times the amount unwound during its first episode of QT from 2017 to 2019. Despite the longer duration and larger scale of the current QT cycle, the process has proceeded relatively smoothly, with minimal disruption to the Fed's control over interest rates. However, the minutes from the January FOMC meeting revealed that the Committee has discussed the possibility of “pausing or slowing” the runoff soon. This comes as a surprise, given that Fed Chair Powell had downplayed concerns about the balance sheet in his post-meeting remarks. Nonetheless, with the dynamics of the debt ceiling and its impact on bank reserves, it is becoming increasingly prudent for the Fed to evaluate the timing of the end of QT.
During the last round of balance sheet normalization, the runoff ended abruptly. In September 2019, a spike in repo rates – to more than 3.0% above the Fed Funds target range at the time – forced the central bank to intervene to stem upward pressure on both secured and unsecured money market rates. This was driven by the low aggregate level of bank reserves, which declined as the Fed’s asset holdings decreased, reducing liquidity on the liability side of the balance sheet. In the current cycle of QT, the decline in the Fed’s asset holdings has largely been offset on the liability side by a reduction in the reverse repo facility (“RRP”), which is viewed as a measure of excess liquidity. This has allowed the level of reserve balances to remain relatively stable. However, with the RRP now approaching zero, ongoing QT will more directly reduce bank reserves and risk greater impact on money market rates.
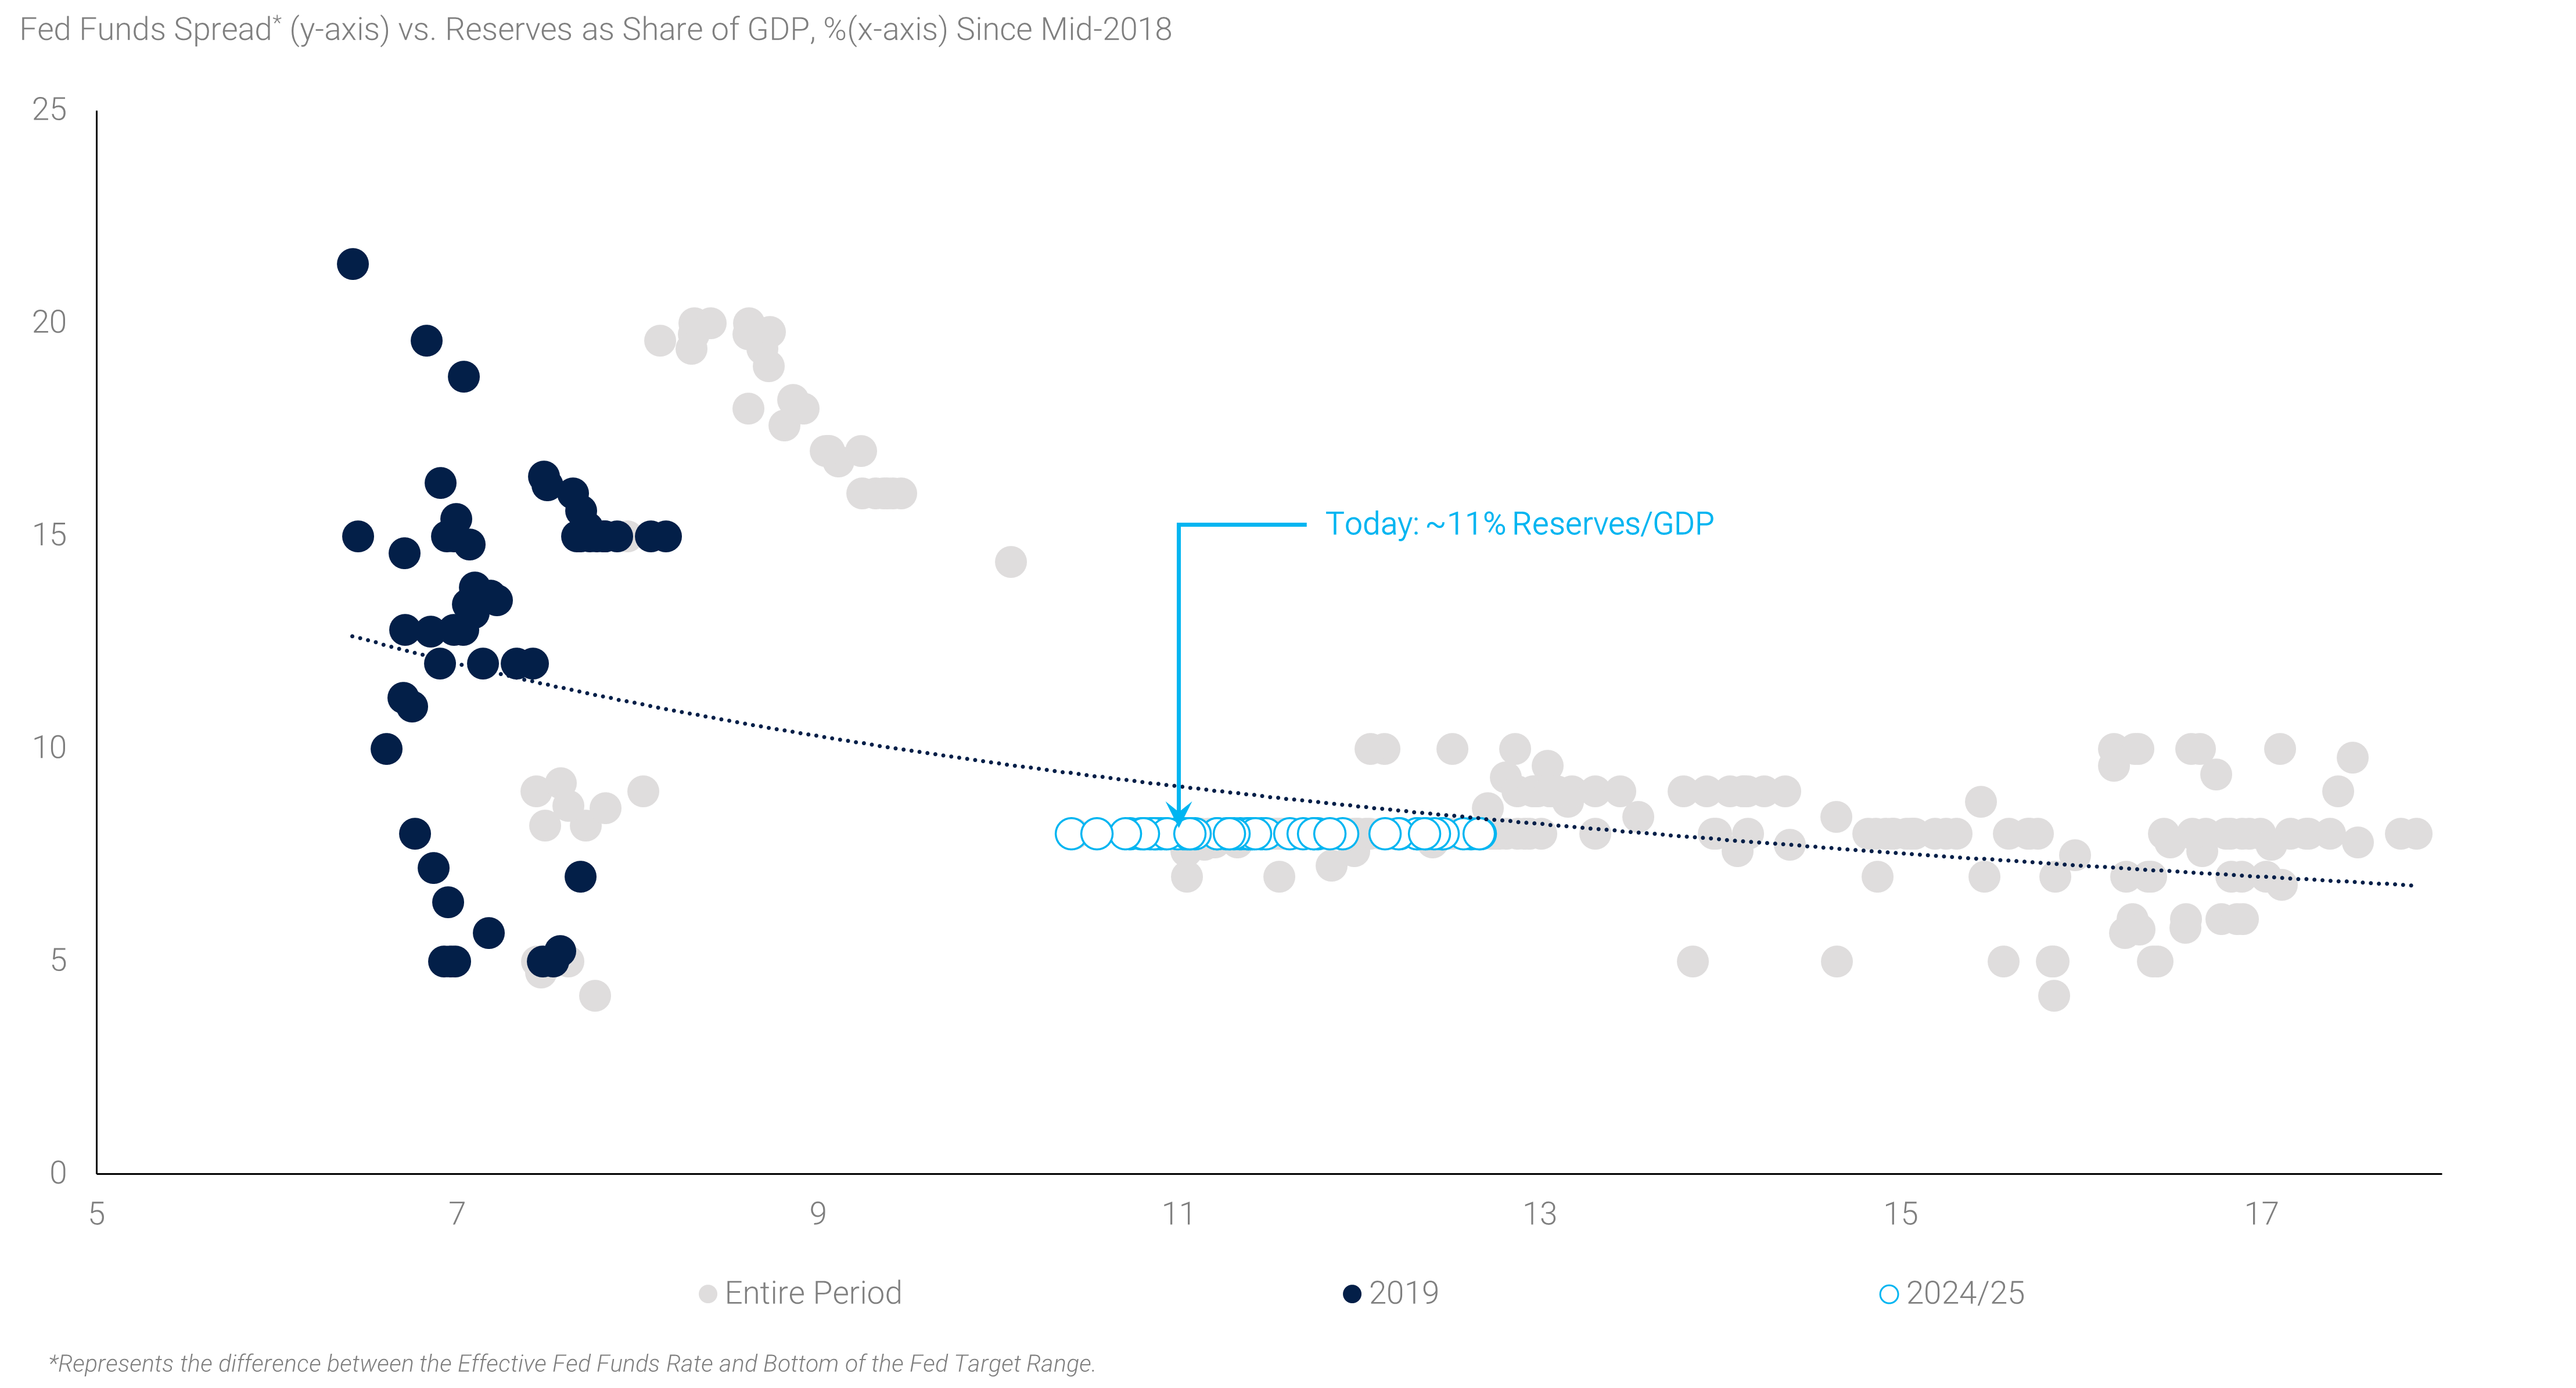
In early 2024, Fed Governor Christoper Waller signaled that 10% to 11% of GDP would be “an approximate end point for draining reserves out of the system”(2) without causing too much volatility in money market rates. As shown in panel 3, the reserve demand curve appears to steepen when reserves near 10% of GDP, but the variability of money market rates to the Fed’s target range is wide. Currently at $3.3 trillion, reserves are already nearing the lower end of a comfortable range. Moreover, the near-term outlook for the level of reserves is complicated by the dynamics of the government’s debt ceiling.
Panel 3:
Effect of Declining Reserves on Front-End Rate Volatility
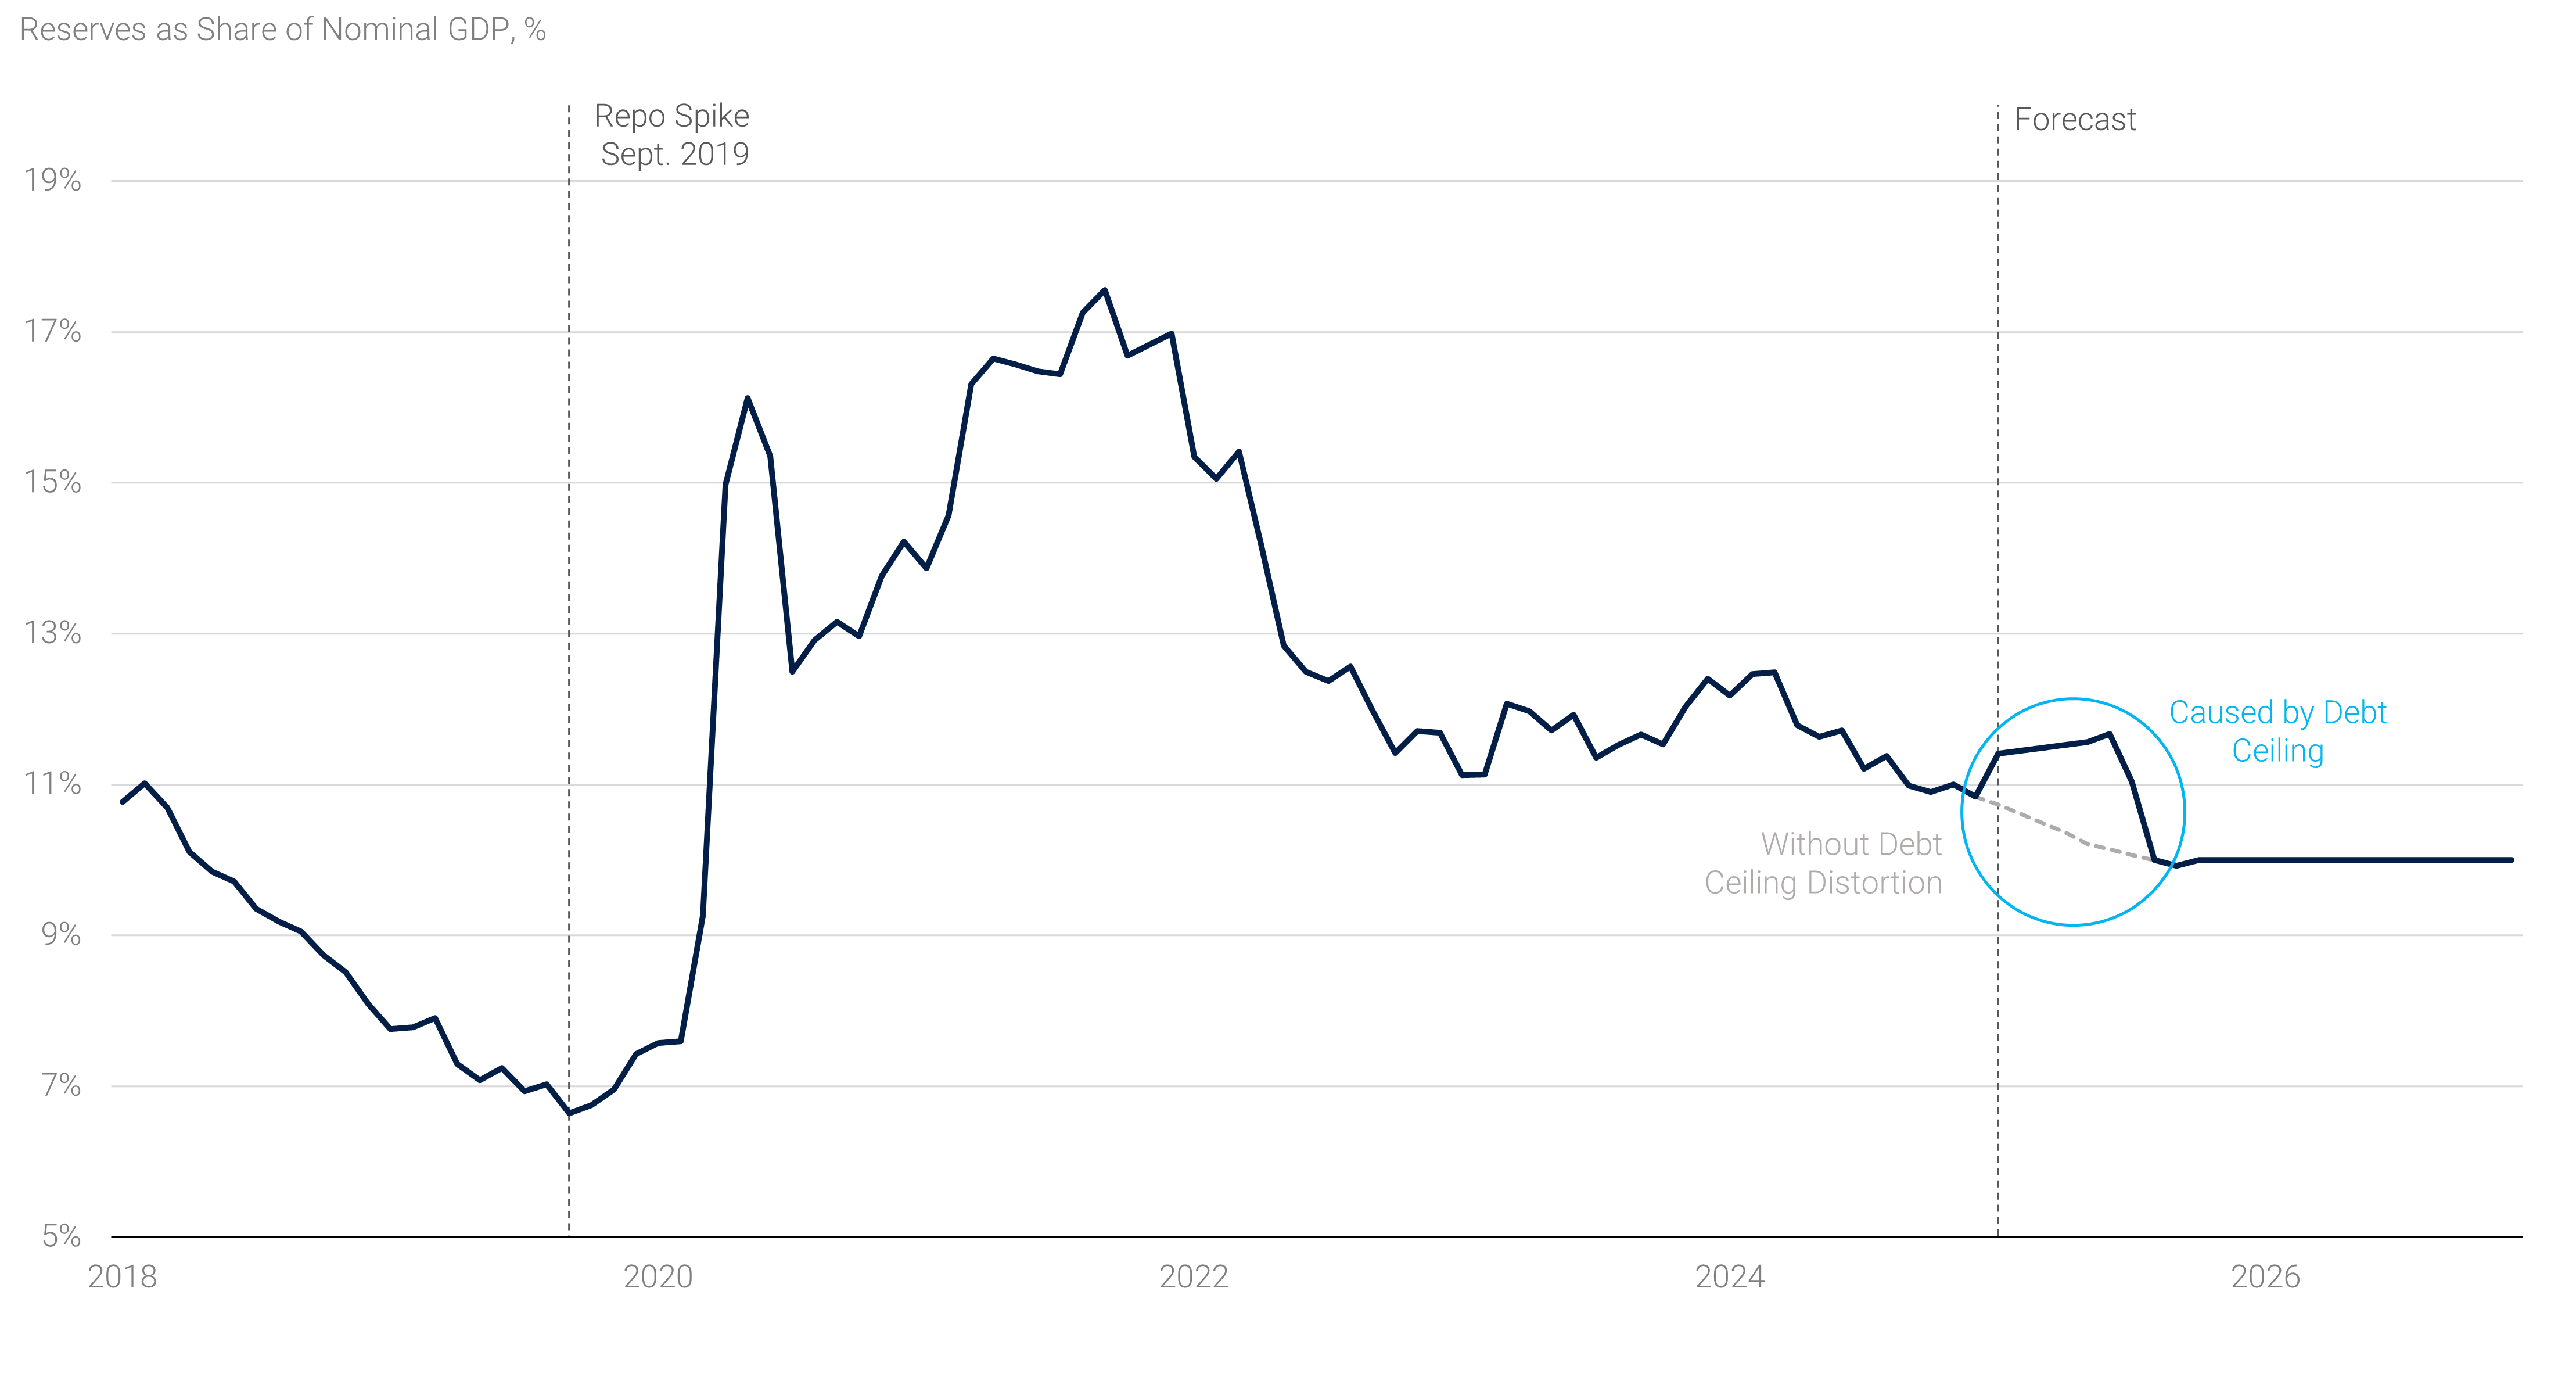
The Treasury has been operating under the debt limit since January, using extraordinary measures to increase Bill issuance and maintain its cash balance. However, the stability of this cash balance will be increasingly affected the longer Congress takes to increase the debt limit to a higher level. Constrained in its borrowing ability, the Treasury will ultimately draw down its cash balance and boost bank reserves, temporarily masking the impact from the decline in the Fed’s asset holdings. Once the debt ceiling is resolved, however, the Treasury will replenish its cash balance, pulling cash out of the financial system at a presumably rapid pace and resulting in a sharp decline in bank reserves (see panel 4). For example, as the Treasury cash account approaches zero, reserves could reach as high as 12% of GDP, before dropping back to 10% of GDP in a matter of weeks.
Panel 4:
Debt Ceiling Masks Declining Reserves
The Fed has expressed its intent to engineer a gradual and smooth decline from an “abundant” supply of reserves to an “ample” supply, allowing them time to respond to emerging signs of reserve scarcity and avoid a repeat of the 2019 repo market turmoil. However, the dynamics surrounding the debt ceiling have shifted control over reserve balances to the Treasury, with the timing of a resolution playing a significant role. A sudden, unintentional squeeze in reserve levels would leave the Fed with little time to react to liquidity pressures in money markets.
Given these complexities, the January FOMC minutes indicated the possibility of pausing or slowing the runoff. Slowing QT by reducing the amount of Treasury runoff each month would help to lessen the impact of the volatility and allow their assets to decline a bit further. We see little benefit to pausing or slowing for a few months only to end it shortly thereafter and we believe it would be prudent for the Fed to avoid reserve volatility that could undermine control over short-term interest rates. Instead, it makes more sense to end the passive runoff of the balance sheet sooner, allowing the liability side of the balance sheet to grow organically for a longer period, rather than risk an abrupt end to the current QT. A squeeze in reserve levels would force immediate market intervention and asset purchases, directly contradicting the FOMC’s stated preferred gradual and smooth approach. The Fed may want to be cautious as it approaches the final phase of balance sheet normalization, particularly amid well-anticipated reserve volatility.