After the shutdown-induced blackout, official sector data released in the month of December offered the first lens into the state of the U.S. economy entering the final stretch of 2025. Altogether, the narrative held: subdued hiring and firing continued to characterize a softening labor market, while the economic expansion remained powered by resilient consumption, strong AI investments, and trade normalization. However, key missing pieces of information, including the October unemployment rate and inflation data, muddy certain aspects of the broader picture.
Economic Growth
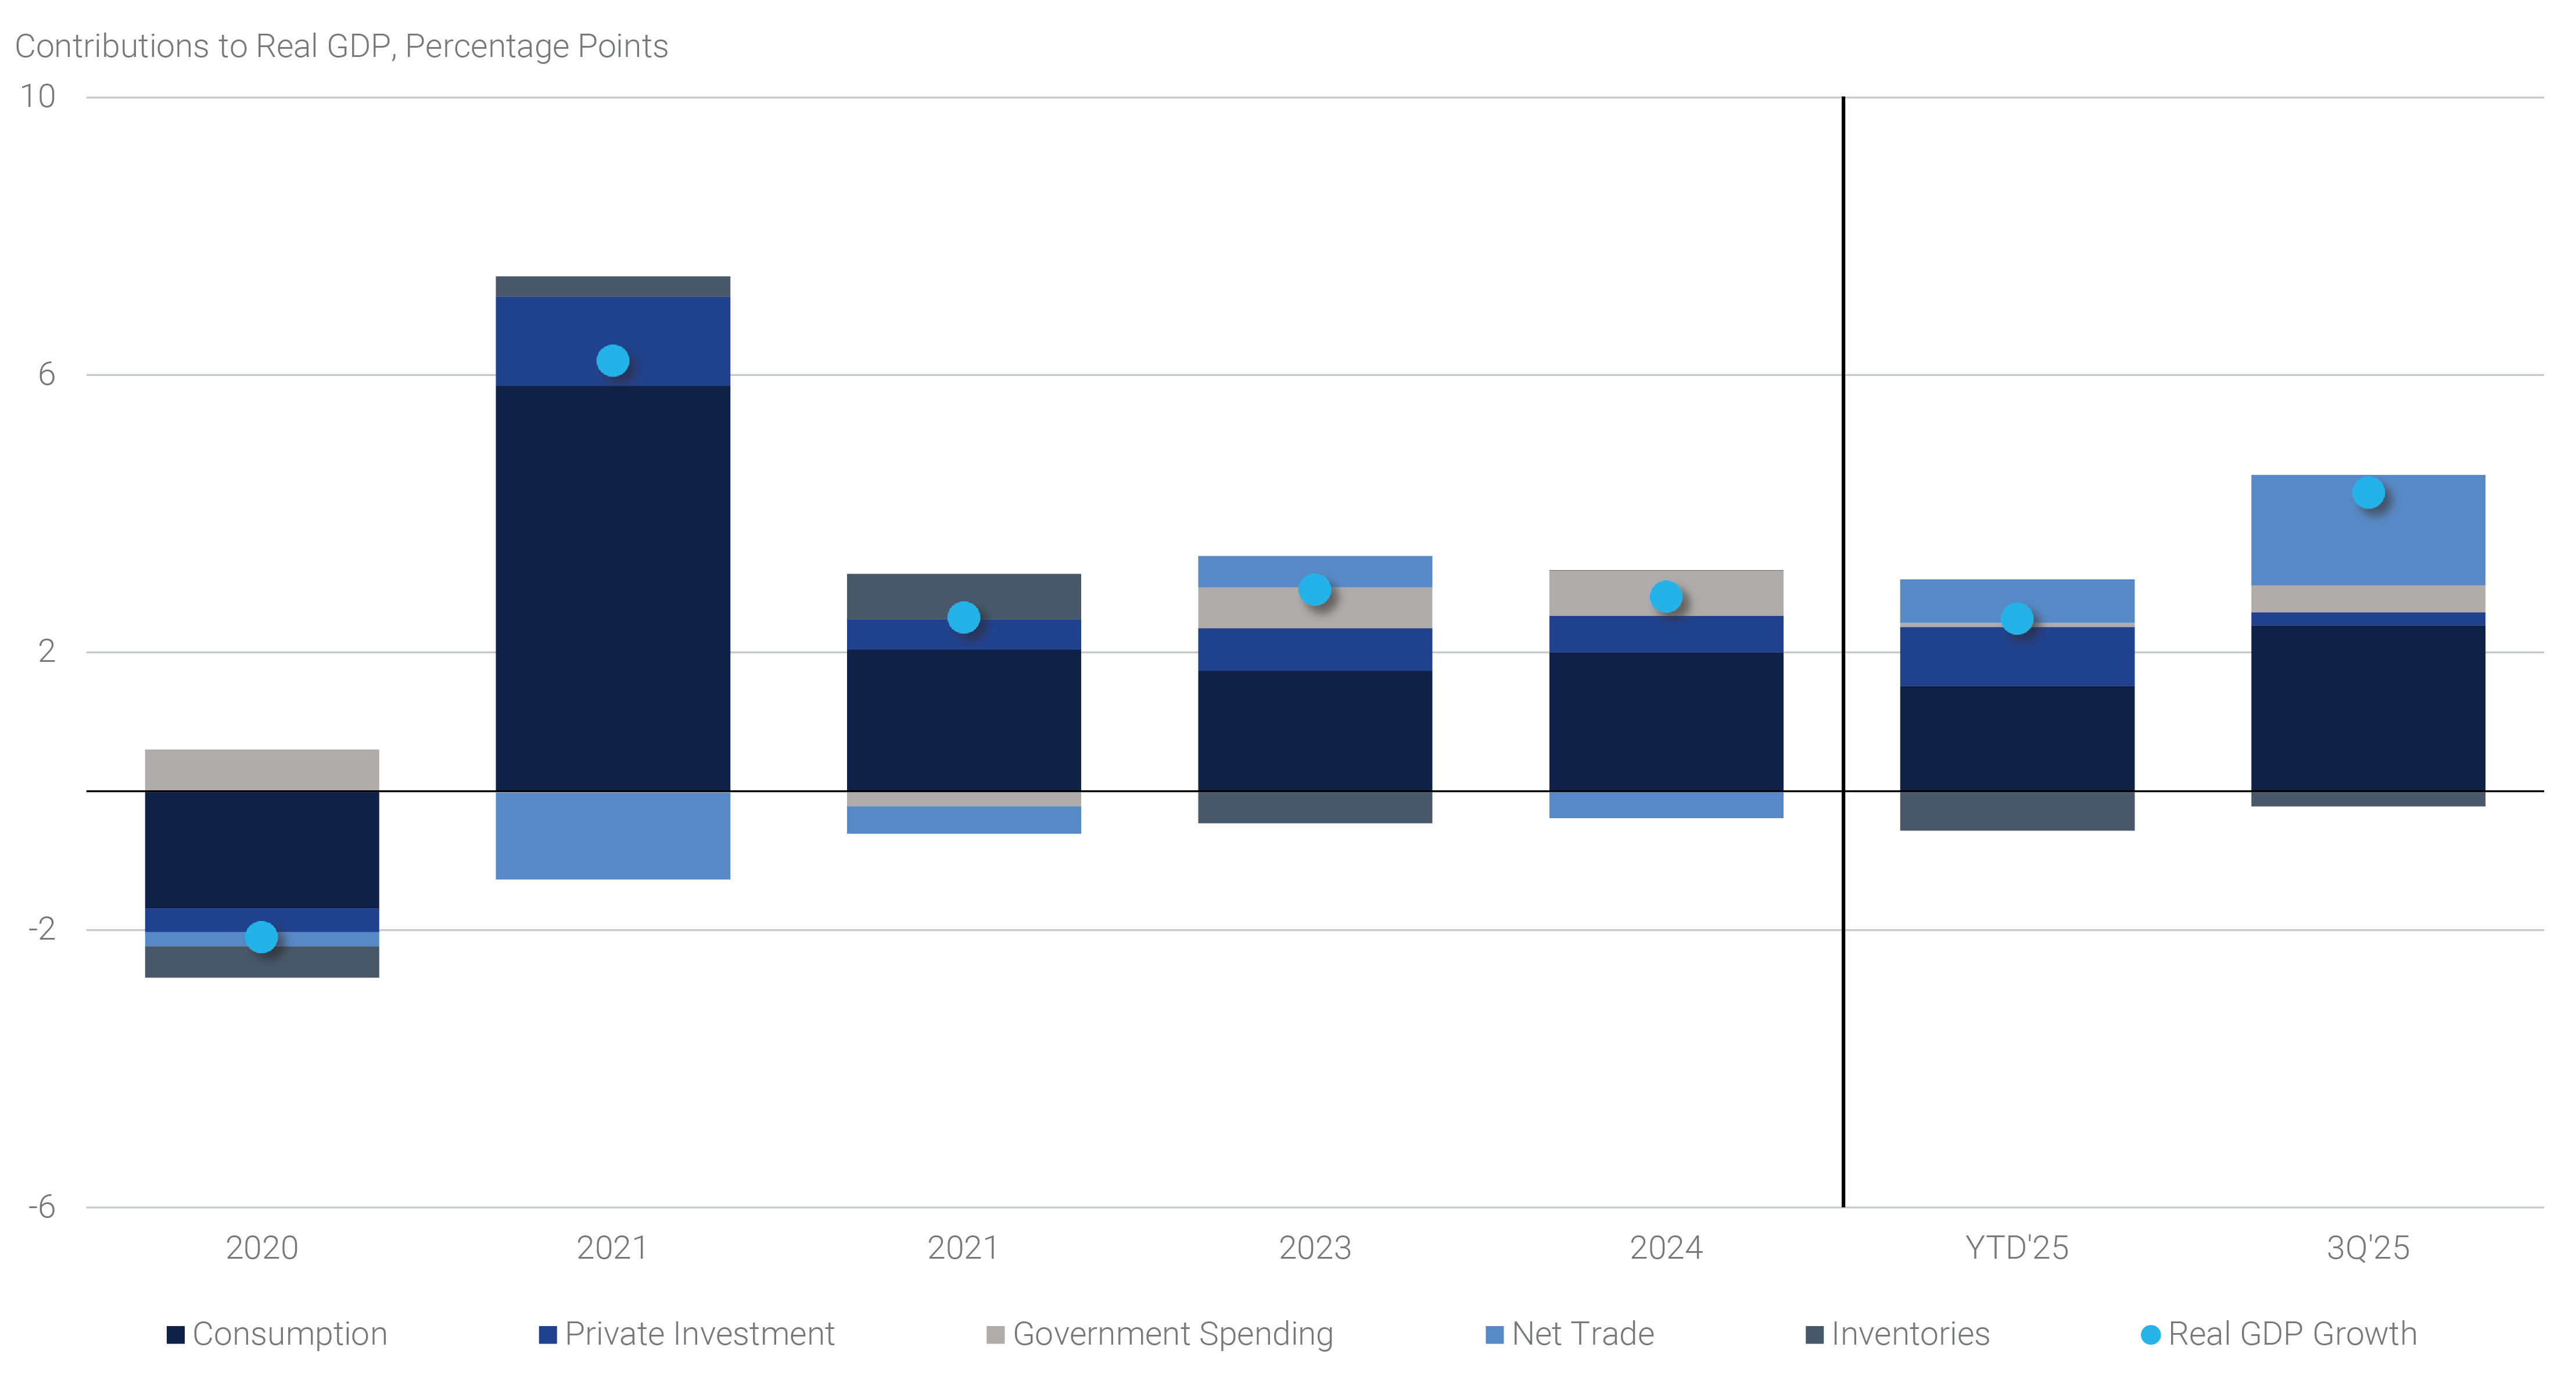
The long-awaited Q3 GDP report showed the economy expanded at a much faster than expected 4.3% seasonally adjusted annualized rate (“SAAR”) (see panel 1), driven by healthy consumer spending (3.5% SAAR) – an improvement in personal consumption activity relative to the first half of the year. Meanwhile, trade boosted GDP by +1.6 percentage points, remaining meaningfully above average historical contributions. Looking ahead, Q4 growth should moderate due to a combination of a shutdown hangover, potentially slower spending (we’ll fully believe it when we see it in the data), and a reversal from the trade boost. Beyond that, we expect the U.S. economy will continue to grow modestly above trend driven by the same set of factors that have driven the current expansion. In addition, wealth effect benefits from strong stock prices and potential incremental fiscal stimulus ahead of the midterm elections could further boost activity.
Panel 1:
Growth Momentum Continues
Labor Market
December brought an unusual double employment report, showing that the U.S. labor market ended November with 41,000 fewer jobs than in September. Of note, October saw the largest monthly jobs decrease in almost five years mainly driven by 162,000 federal employees exiting payrolls after accepting the Department of Government Efficiency, or DOGE, deferred resignation offer. Private-sector hiring was steady, rising 52,000 and 69,000 over the past two months, respectively, and bringing the 3-month average up to 75,000 from 57,000 in September. Yet, hiring continues to be driven by cyclically insensitive industries, including healthcare, social assistance, and restaurants. Despite the better hiring, the unemployment rate rose to 4.56% in November, from 4.44% two months earlier, as the labor force continued to rise, but many incoming workers were unable to find a job.
Inflation
Turning to prices, the November Consumer Price Index (“CPI”) reading was significantly lower than expected, with the CPI excluding food and energy (core CPI) falling to 2.6% year-over-year (“yoy”), compared to expectations of a 3.0% yoy increase. However, confidence in the deflationary signal is limited, as shutdown-related methodological quirks likely distorted the data for the October/November report in three main ways. First, given the timing of the end of the shutdown, the sample period relied heavily on the period around Thanksgiving that typically sees larger use of discounting by retailers. Second, the Bureau of Labor Statistics decided to carry prices for cities sampled in August to October,(1) effectively showing no change between the periods, thereby lowering the index level. Third, semi-annual shelter calculations assumed no change in rents between April and October, thereby carrying no price change for approximately one-sixth of the surveyed rents. We therefore take little signal from the CPI report and wait for future data to gauge the extent of November’s temporary noise.(2)
Financial Markets
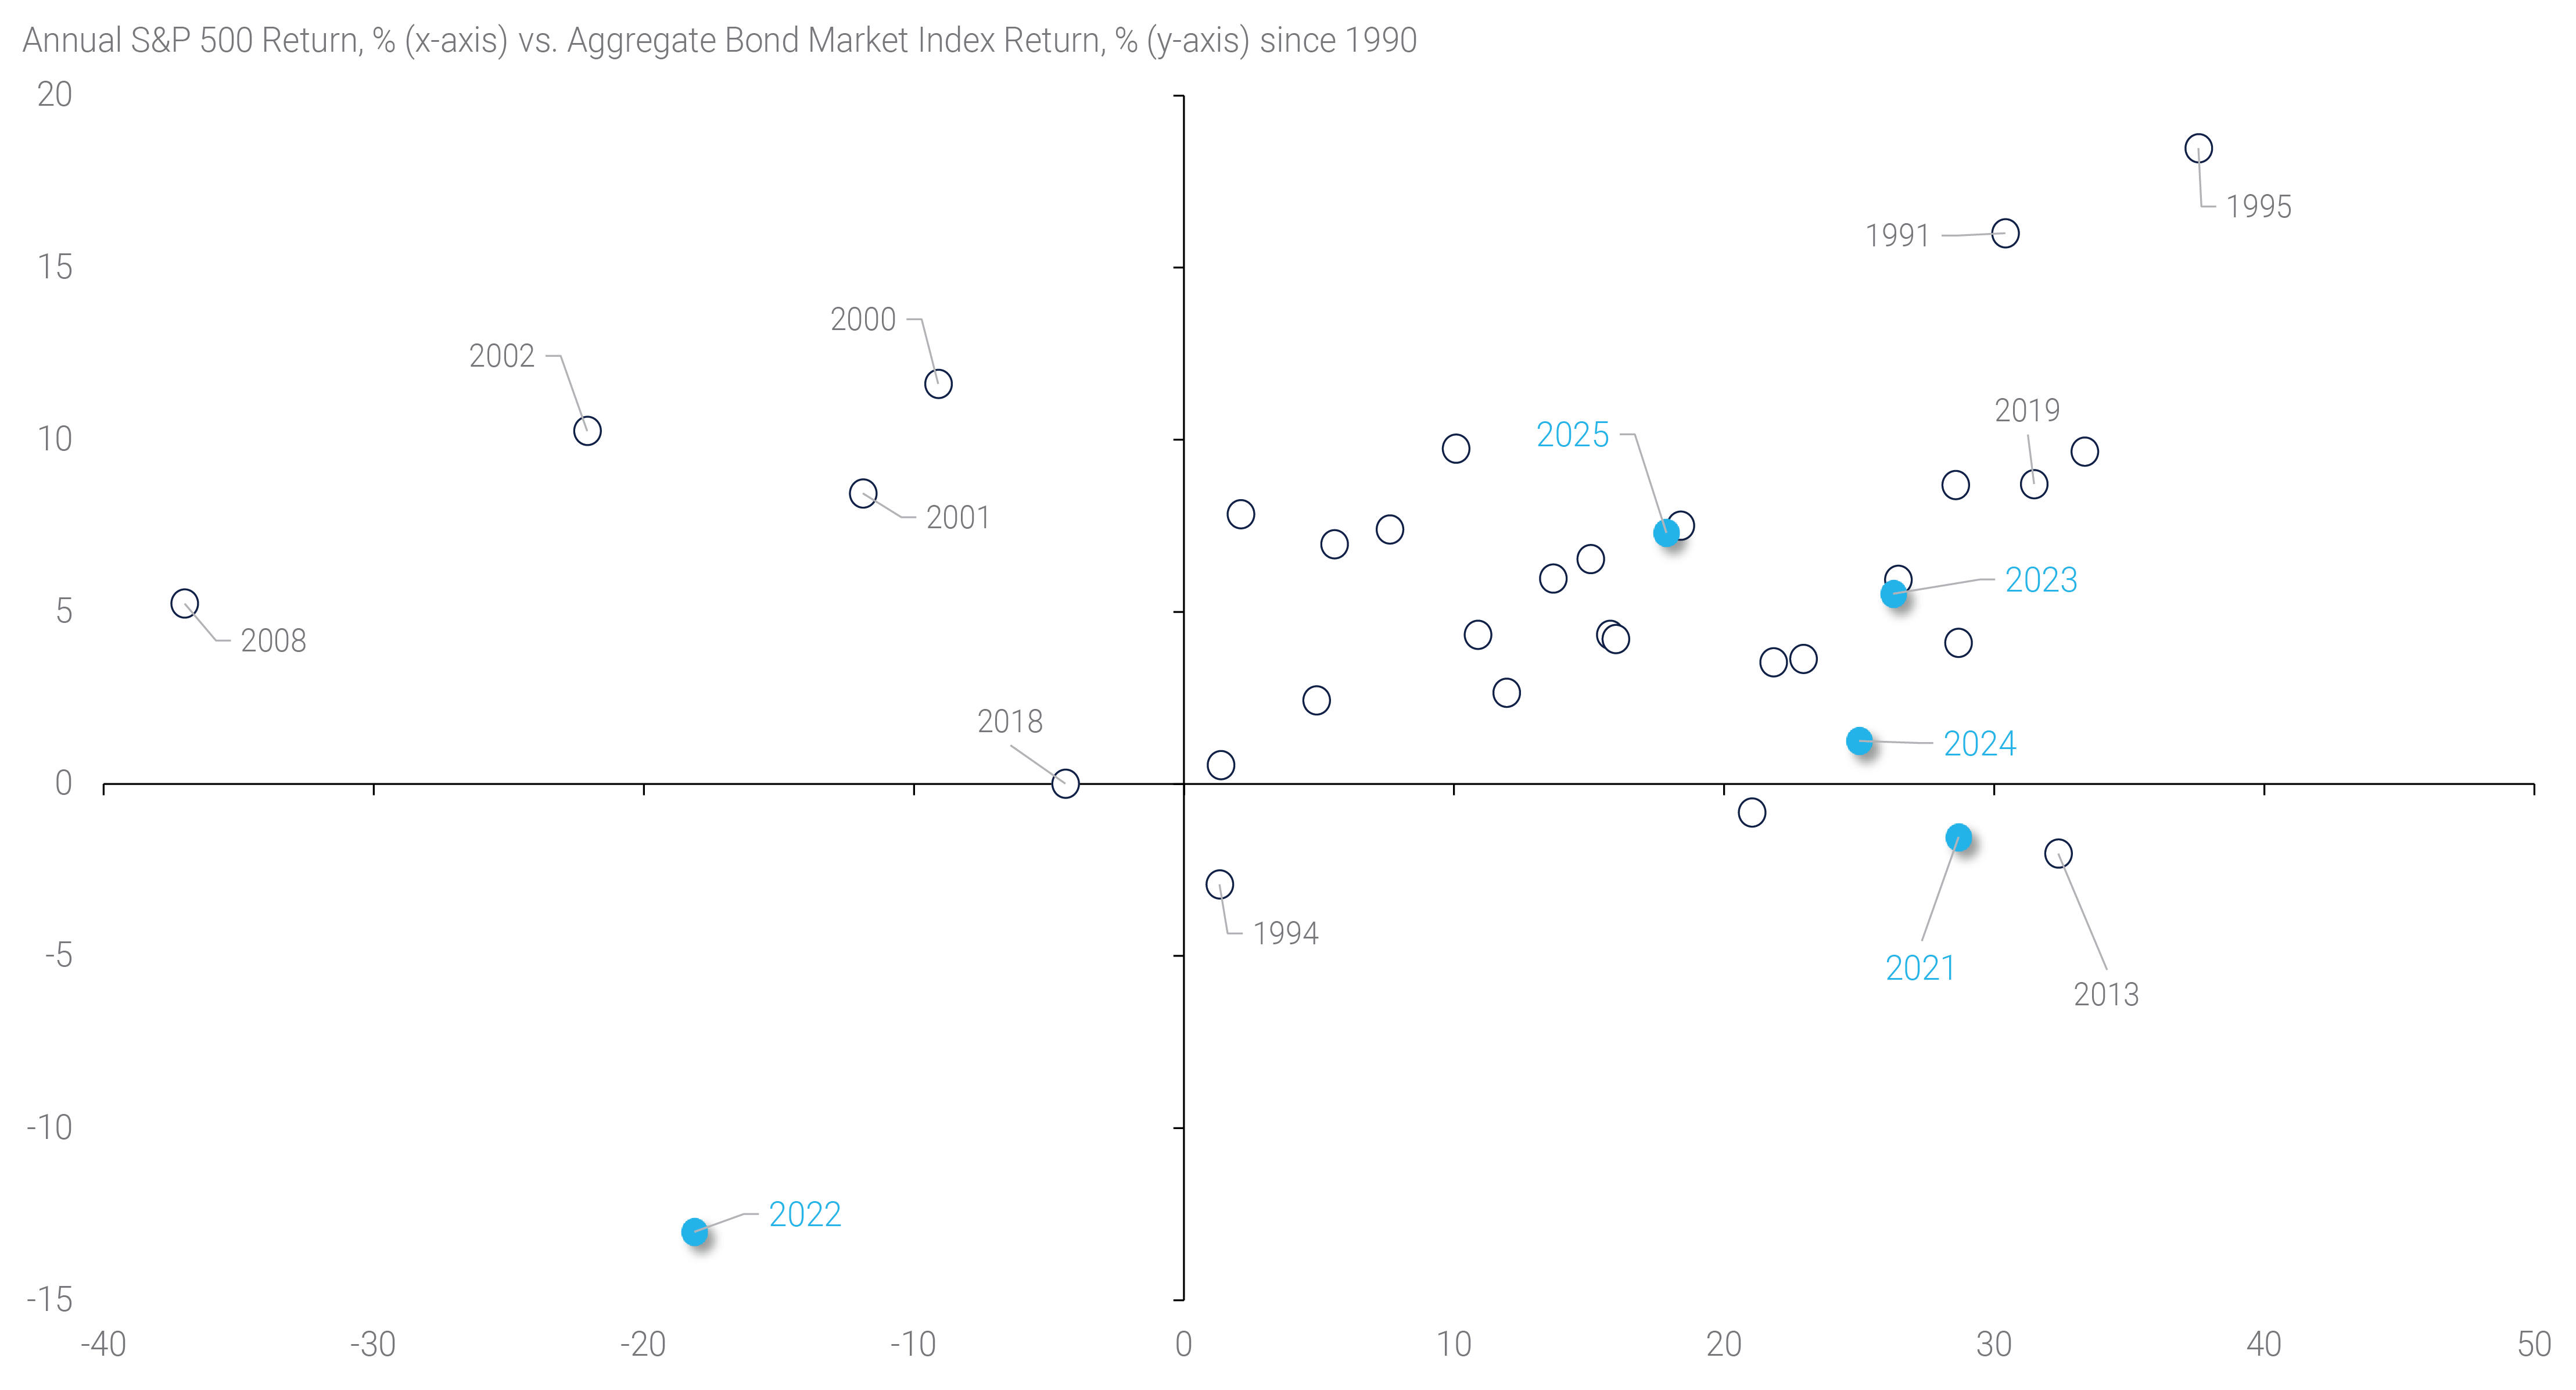
As 2025 came to a close, markets largely delivered on the broad expectations set at the start of the year, when investors anticipated an environment similar to 2017: strong asset returns fueled by robust growth, a business-friendly environment centered on deregulation, and lower volatility. Though the April tariff announcement temporarily challenged that narrative, it ultimately did not derail it. By year end, both equity and fixed income markets posted strong results. Measured by the S&P 500 and the U.S. Aggregate Bond Market Index, stocks and bonds returned a 17.9% and 7.3% total return during the year, respectively, with the latter recording the strongest annual return since 2019
(see panel 2). Against this broader backdrop, December trading reflected both a continuation of key 2025 trends and the early formation of themes likely to shape markets in the year ahead.
Panel 2:
Stocks and Bonds Deliver in 2025
The Treasury yield curve steepened in December while volatility declined. Long-end yields drifted higher over the month, while front-end rates moved lower, leaving the curve materially steeper by year end. The 5s30s Treasury curve ended December near 112 basis points (“bps”), a level last seen in late 2021. Despite the move, the 30-year yield finished the year little changed from a year earlier, while the front end led the rally, with 2-year yields down roughly 80 bps yoy. Further, rate volatility continued to grind lower in December, extending a broader decline seen in recent months, with 1-year 10-year swaption implied volatility falling back to levels last observed almost four years ago. We expect this combination of a bullish steepening bias and relatively subdued volatility to persist in coming months.
Monetary Policy as the Primary Driver
Monetary policy developments remained the central force shaping markets in the month. At its December meeting, the Federal Open Market Committee (“FOMC” or the “Committee”) lowered the target range for the federal funds rate by 25 bps to 3.50–3.75%. However, the decision was carefully balanced with several hawkish signals, suggesting further rate cuts would only materialize if the labor market weakened further. The Committee revised its statement to imply a higher bar for further cuts, which Chair Powell reinforced in his press conference, and the meeting featured both formal dissents and a notable number of hawkish “silent dissents” in the 2025 dot plot.
The Minutes from the meeting emphasized the sense of a Committee navigating meaningful tradeoffs. Participants acknowledged increasing downside risks to the labor market and signs of fragility beneath the surface while at the same time expressing concern that inflation pressures could remain persistent — or become re-entrenched — if policy were eased too aggressively. Importantly, this debate occurred against a backdrop of sound economic growth, complicating the policy outlook. Several participants characterized the December cut as “finely balanced,” underscoring how close the decision ultimately was.
Despite the wide dispersion of views within the Committee, markets continue to price a relatively orderly easing path, with roughly two additional rate cuts expected in 2026, currently centered around midyear. That pricing implies a policy pause through the spring, coinciding with the expected transition to a new Fed Chair following the end of Chair Powell’s term in May. While President Trump has indicated he has a preferred candidate, markets have so far resisted pricing a meaningfully more dovish policy regime, perhaps given the current litany of views among FOMC members. The terminal policy rate has remained anchored near 3% for several months, suggesting investors remain focused on fundamentals rather than political speculation.
Balance Sheet Policy and Treasury Demand
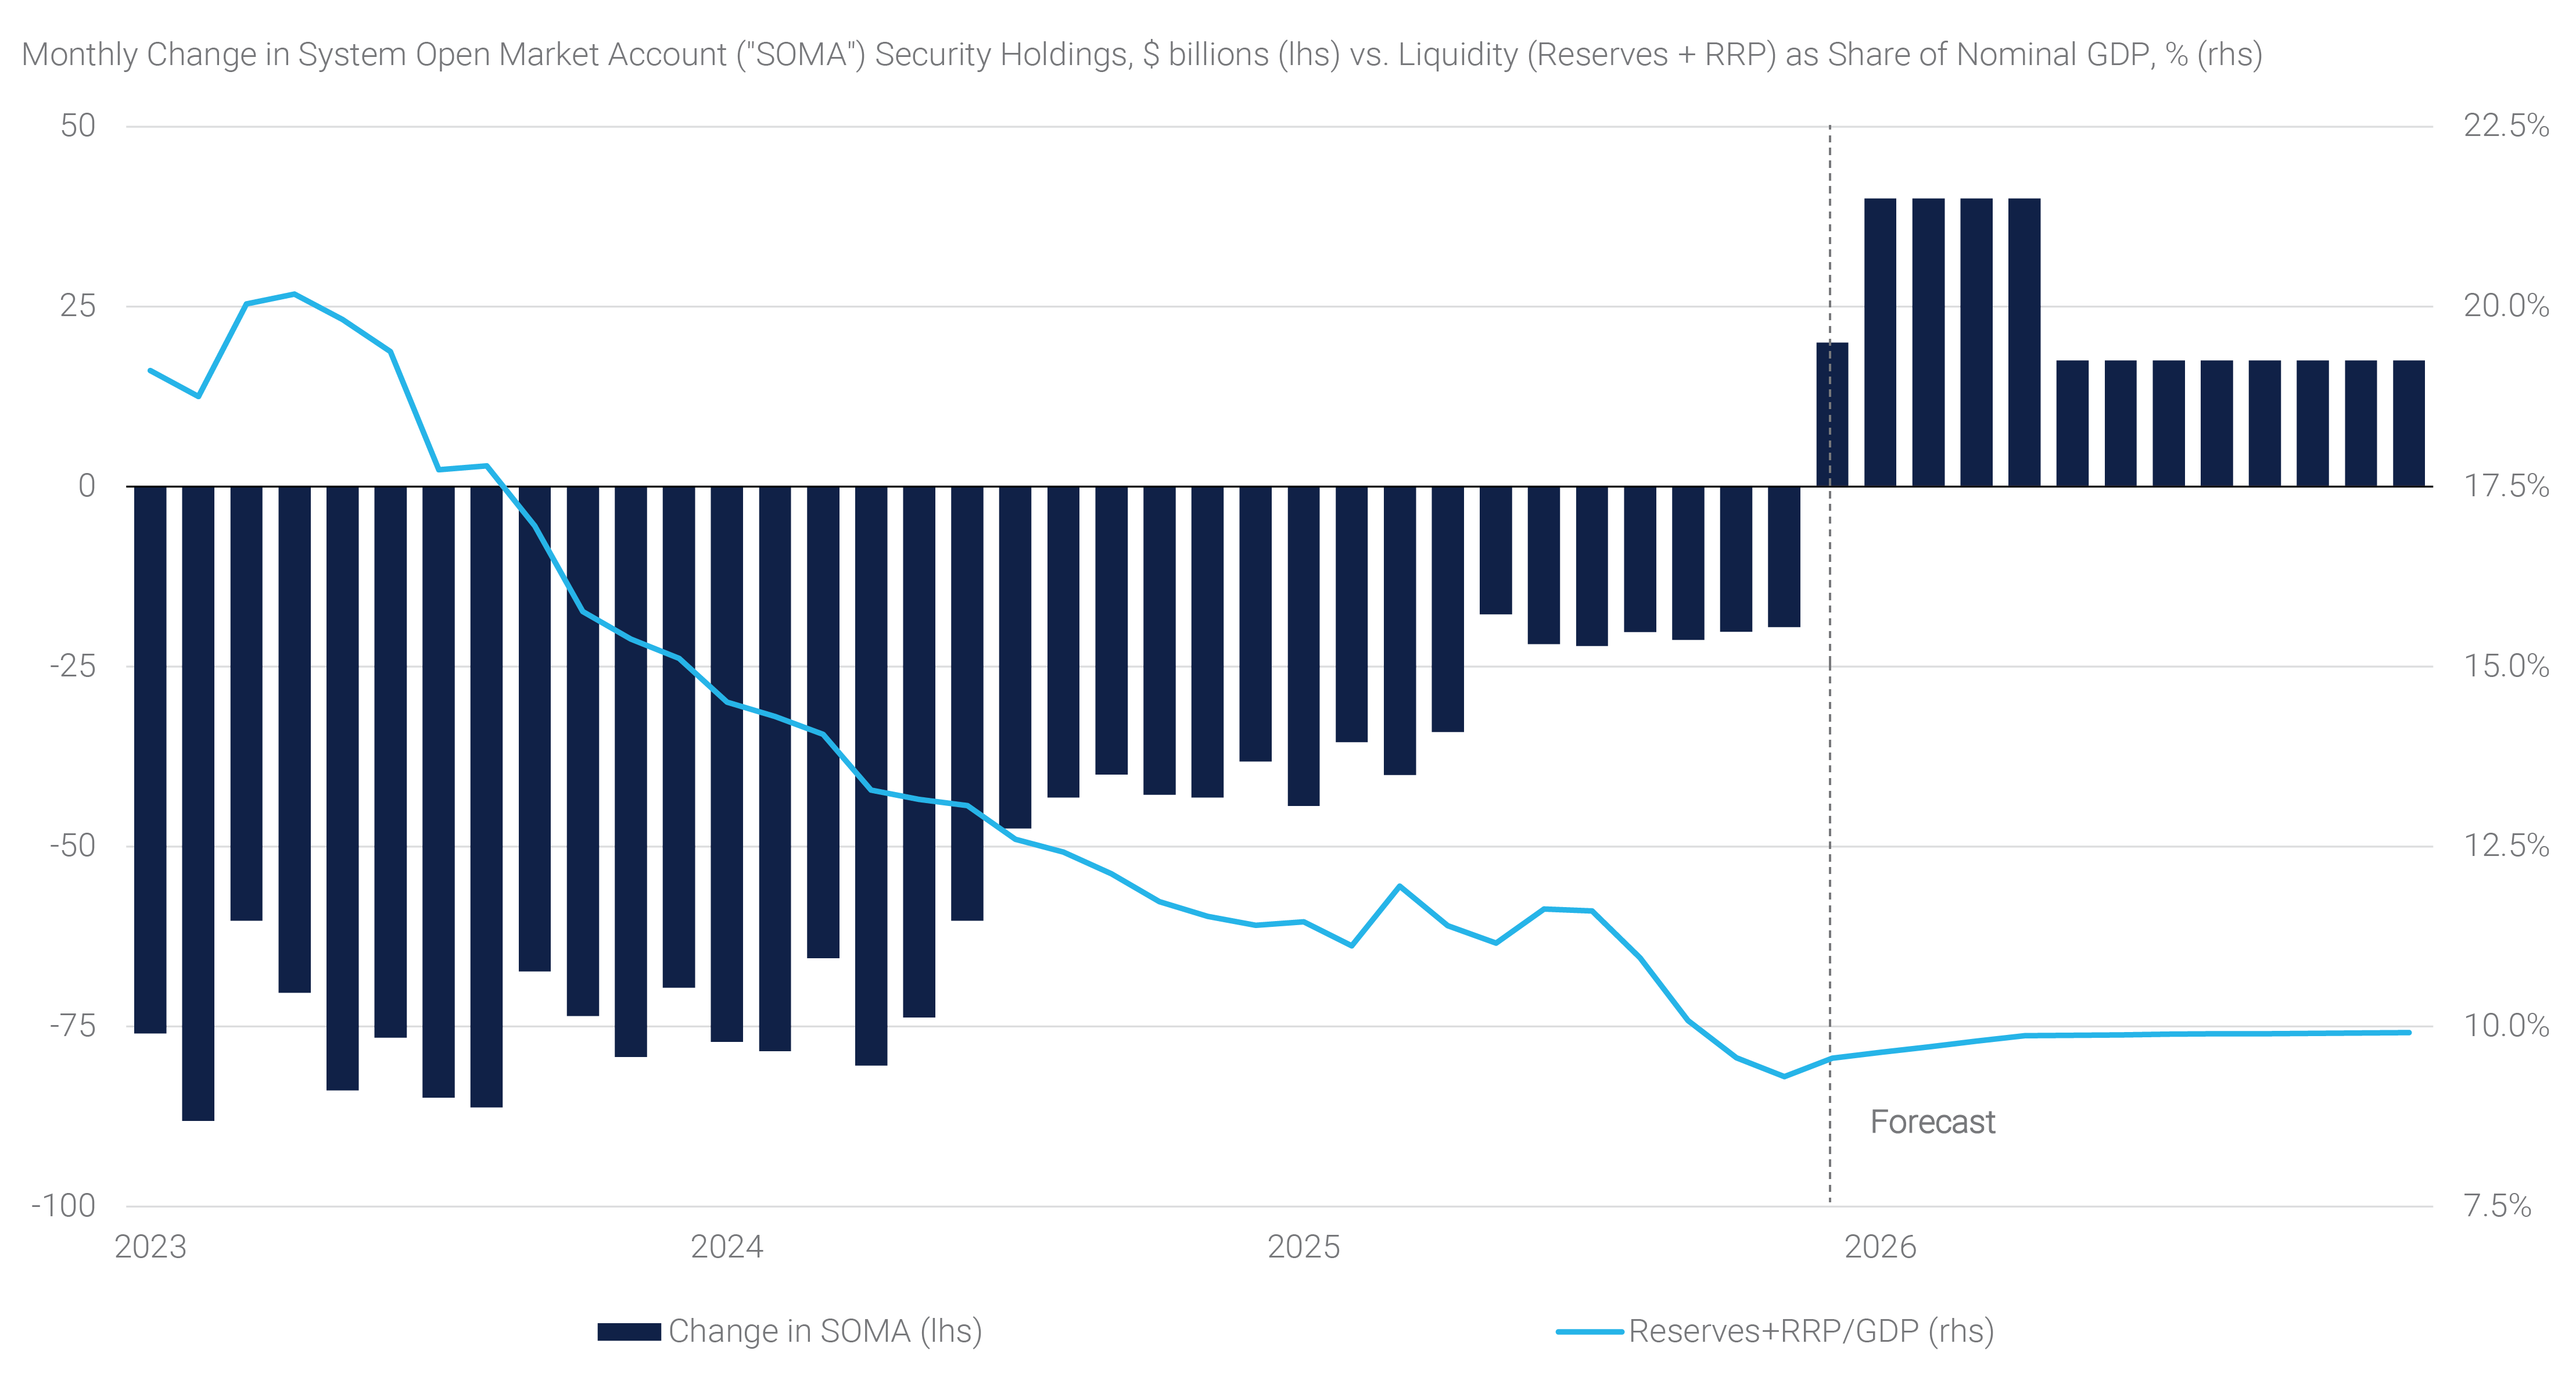
Beyond rate policy, December marked a major inflection point in the Fed’s balance sheet strategy. The FOMC announced the conclusion of quantitative tightening (“QT”) and the transition toward gradually expanding its balance sheet to maintain a ratio of reserves relative to the size of the economy. To that end, the Fed has begun Reserve Management Purchases (“RMPs”), initially running at $40 billion per month and concentrated in Treasury bills. We estimate that maintaining the Fed’s desired “ample reserves regime” will require roughly $300 billion of bill purchases in 2026 (see panel 3).
Panel 3:
End of QT and the Return of Balance Sheet Growth
This shift should stabilize funding markets as reserves are being rebuilt. Repo markets are likely to become less volatile, with the spread between general collateral repo rates and SOFR narrowing as Fed bill purchases recycle cash back into money markets. Notably, year-end funding pressures were more muted than many had feared, an early sign of these dynamics at work.
Beyond the front end, the outlook for Treasury demand has improved as well. Bank balance sheets have stabilized, foreign investors have been consistent buyers despite fears over international diversification away from the U.S. Dollar, and the end of QT removes supply to the private market. Taken together, a more stable funding environment, improved structural demand, and a Fed that is either on hold or gradually easing point to a modestly bullish outlook for U.S. rates in 2026. The most likely pressure point remains on the long end, however, as investors are likely to demand term premium amid ongoing fiscal uncertainty.
A Constructive Year for Agency MBS
One of the major benefactors of the fixed income market environment in 2025 was Agency MBS. The Bloomberg Agency MBS return index delivered an 8.6% total return over the year, marking a 1.7% excess return versus Treasuries. This marks the strongest relative performance since 2010 and represents a notable turnaround for the asset class that had seen a challenging backdrop in the post-pandemic tightening cycle. Following a solid year, it is worth reviewing some of the factors lifting the sector in 2025 and discussing what lies in store for 2026.
For over a decade after the Great Financial Crisis of 2008 (the “GFC”), demand for Agency MBS was dominated by the Fed and banks. The Fed went through multiple versions of quantitative easing (“QE”), which involved buying Treasuries and Agency MBS, thereby injecting additional liquidity to the banking system. Flush with additional reserves, but with limited opportunity to make loans, banks purchased Agency MBS alongside the Fed, leading the two largely price-insensitive investors to own 60% of the universe by the end of 2021, compared to about 22% pre-GFC.(3) All of this ended abruptly in 2022 when the Fed not only stopped QE but quickly pivoted to QT. With declining reserves, banks’ appetite for MBS declined sharply. This was further exacerbated by the rapid shift in monetary policy and interest rates – including meaningful inversion of the yield curve – and the 2023 regional banking crisis.
While demand from the largest sponsors of MBS was collapsing, organic growth in the Agency MBS sector remained robust due to the sharp increase in home prices and the Housing and Economic Recovery Act of 2008 mandated annual increase in Agency loan limits. Meanwhile, interest rate volatility remained historically elevated. This combination of a supply/demand imbalance and weaker fundamentals due to increased volatility caused Agency MBS spreads to widen sharply and remain well above historical averages for several years. Starting in 2024, demand came back to the MBS market and fundamentals improved sharply as interest rate volatility declined. For example, the 2025 average level of implied volatility as measured by the ICE Bank of America MOVE Index declined 15%, marking a similar decline to 2024 and the most pronounced decline since 2017. After several years of elevated readings, interest rate option implied volatility is now generally consistent with historical averages.
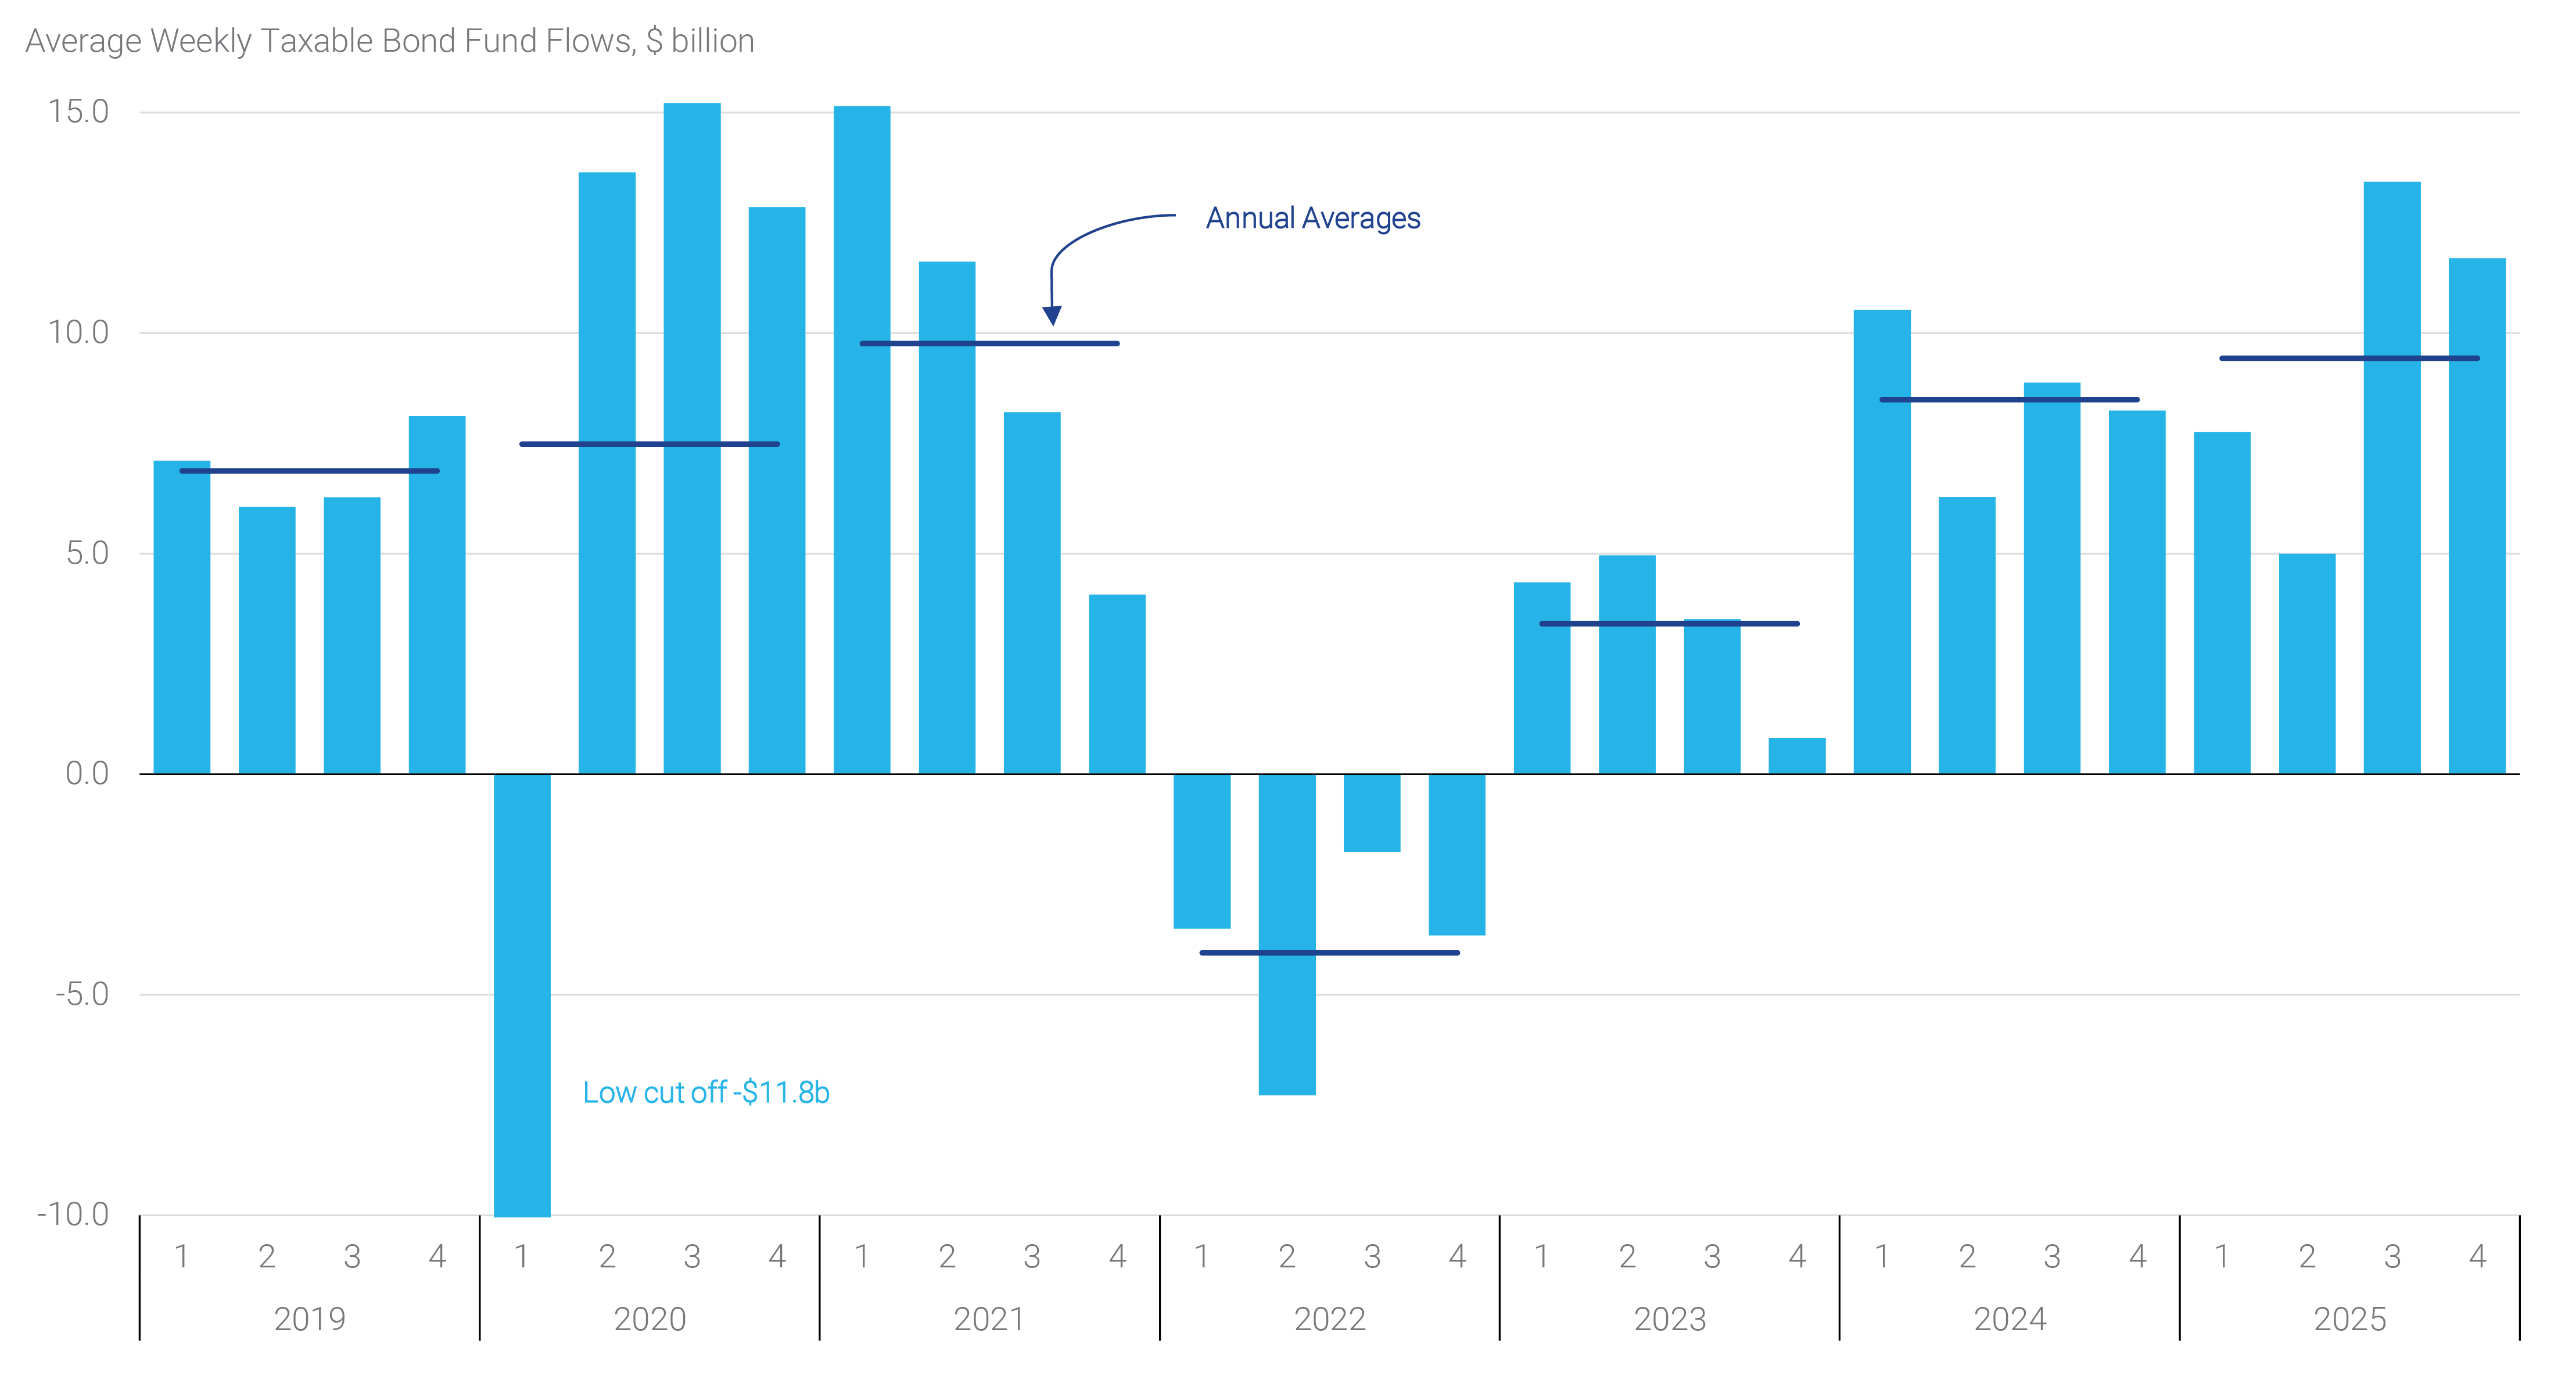
Investor demand has come from multiple sources with improved money manager demand being the key driver given strong inflows into fixed income funds. While fixed income fund flows had been strong at times in recent years, one could argue that the flows proved increasingly durable, particularly in the second half of 2025, when weekly inflows averaged more than $10 billion per week (see panel 4).
Panel 4:
Fixed Income Flows Have Been Robust
In addition, collateralized mortgage obligation (“CMO”) creation was strong, absorbing about 30% of gross Agency MBS issuance. About 60% of the CMO issuance were floater structures that were distributed to wide range of investors, in turn diversifying the demand for Agency MBS beyond its traditional investor base. Meanwhile, mortgage REITs started to trade better as the sharp decline in interest rate volatility decreased their hedging cost. This allowed many REITs to raise additional capital and grow their MBS portfolios. The same dynamic also increased participation from other levered investors in Agency MBS, like hedge funds and the government sponsored enterprises. Fannie Mae and Freddie Mac have added a combined $51.1 billion in loans and Agency MBS in 2025 year-to-date,(4) marking the most notable increase in security holdings during the conservatorship period.
Looking ahead, many of the factors that propelled MBS in 2025 remain in place for 2026. Interest rate volatility remains muted, fixed income fund flows remain strong, REITs generally continue to trade above book value, allowing many of them to raise capital. However, two historically large buyers of Agency MBS – banks and foreign accounts – have shown tepid demand thus far. Any increase in demand from these accounts will be very supportive for Agency MBS in 2026. The key difference from a year ago is that tighter spreads leave investors with lower expected returns for similar risks, such as increasing interest rate volatility that may eventually veer its head along the way.