Key Findings
- The U.S. economy has remained resilient amid the Middle East conflict, with consumer spending and A.I.-driven investment sustaining growth, though softening real incomes and declining labor force participation bear watching. Meanwhile, the inflationary consequences of the oil shock are becoming increasingly difficult to dismiss.
- Treasury yields sold off into mid-month before retracing on improving geopolitical sentiment, leaving the curve meaningfully flatter. Risk assets, meanwhile, continued to deliver strong returns on A.I. optimism and robust earnings growth.
- Markets have responded to the inflation shock not through a broad repricing of long-run inflation expectations, but through a hawkish repricing of the Federal Reserve’s (“Fed”) monetary policy path. Rate cuts are off the table, with meaningful probability now assigned to a tightening cycle.
May saw a second consecutive month where markets were highly focused on news surrounding the ceasefire in the Middle East and whether the Strait of Hormuz can be reopened for shipping traffic. For now, the global economy appears to have dealt with the oil shortage through a combination of sizeable releases of oil reserves, demand substitution and some demand cuts, as well as a partial rerouting of flows including increased U.S. crude oil exports. The U.S. economy continues to show resiliency against higher fuel costs thus far, as consumer spending remained healthy and the A.I. investment boom fuels economic activity. In addition, May represented a transition, as Kevin Warsh was confirmed as the new Fed Chair, taking the reins from Jerome Powell, who remains on the Fed Board for now.
The U.S. Economy
The April Personal Consumption Expenditures (“PCE”) report showed consumers have maintained their typical spending habits despite slowing income growth and the savings rate falling to 2.6%, the lowest level since 2022. Aside from PCE data, the Bureau of Economic Analysis lowered its estimates for the growth rate in the U.S. economy in the first quarter of 2026 to 1.6% seasonally adjusted annualized growth rate although real final sales to private domestic purchasers – economic activity by the domestic private sector – remained roughly in line with initial estimates in a positive sign for underlying aggregate demand.
Labor Market
Labor market data supports the view that employment conditions have stabilized following a soft patch earlier in the year. April non-farm payrolls rose more than expected, maintaining the 3-month average employment gains at 48,000, a level of hiring viewed broadly in line with replacement rates. Other indicators continue to point to our long-used description of a “low-hire, low-fire” environment. Labor demand picked-up modestly in April as job openings jumped to 7.6 million. The openings per unemployed ratio improved to 1.03, somewhat below averages seen in a labor market described as fully employed.
The unemployment rate held at 4.3% on a rounded basis in April, though underlying household survey details were weaker, with the number of employed declining for a fourth consecutive month and labor force participation edging down to 61.8%, the lowest level since October 2021. The renewed downward pressure on the labor force participation rate (“LFPR”) has caught some attention, as the rate has fallen 70 basis points (“bps”) over the last six months.
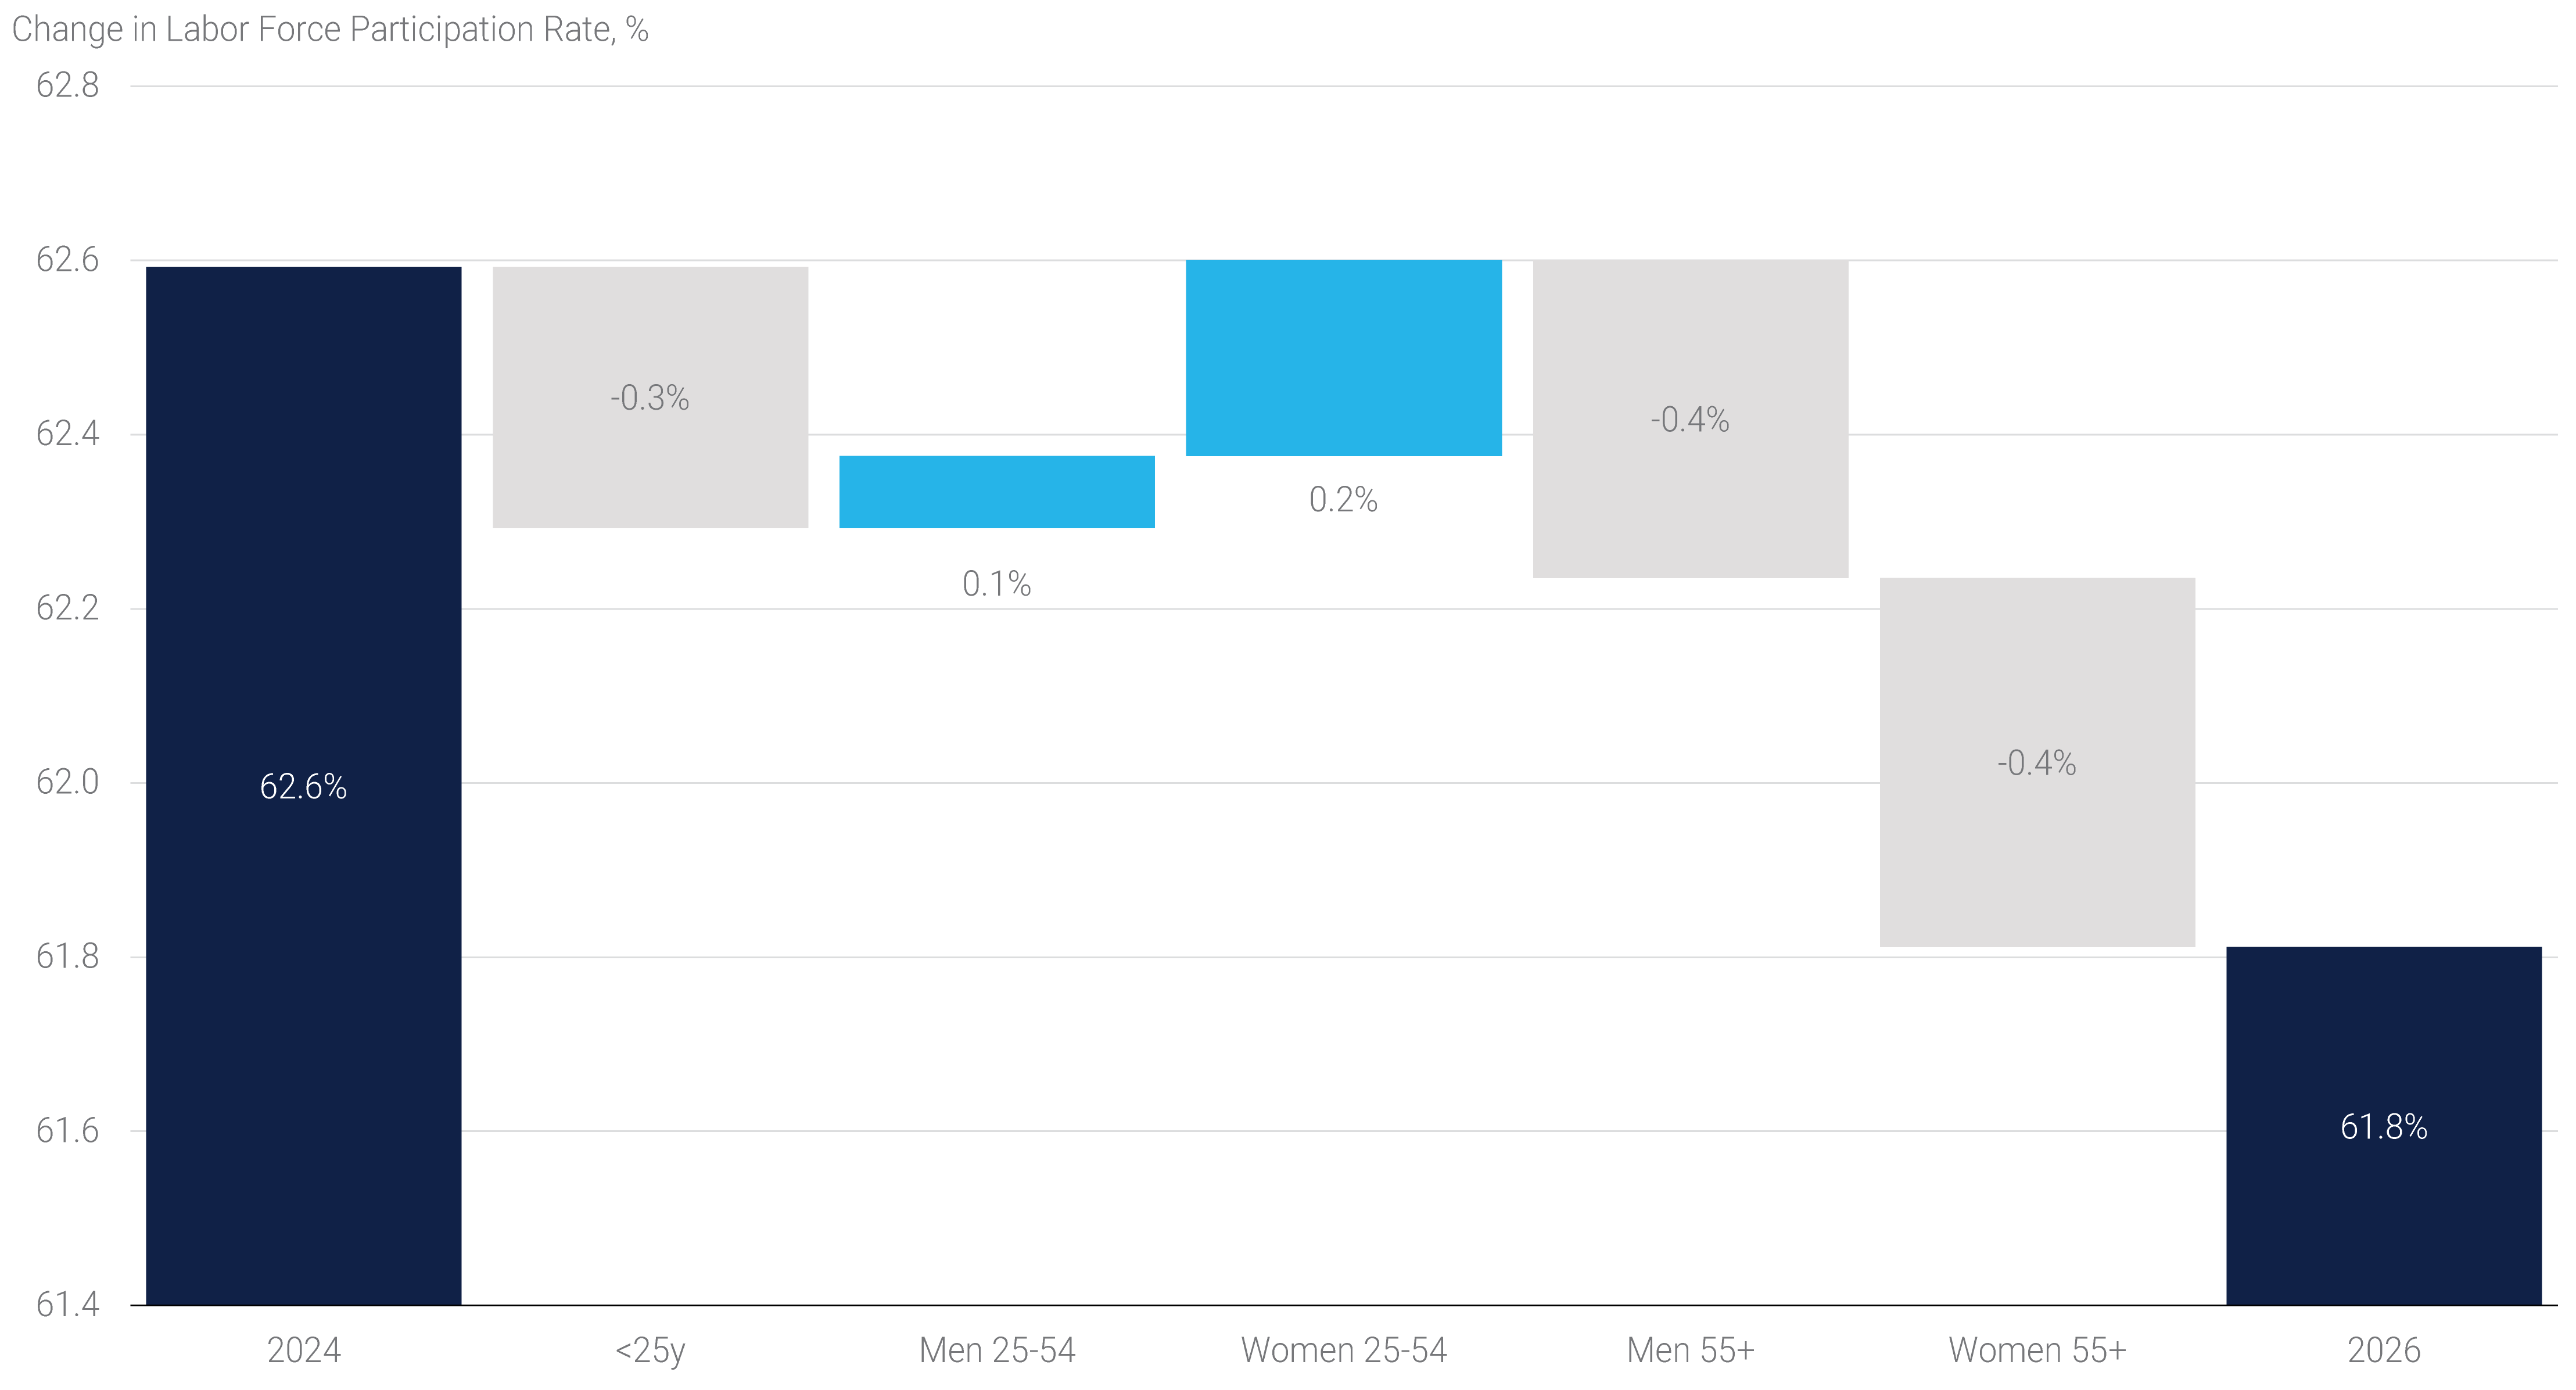
We decomposed the LFPR changes since 2024 into age and gender cohorts.(1) As seen in panel 1, the declines are driven by younger and older portions of the population which appear to be leaving the workforce at higher rates. For older workers, it could potentially stem from changing demographics, as an aging society reduces participation rates naturally. For example, the 55-year and older cohort of men and women contributed two-thirds to aggregate population growth over the reference period, but only 20% of the labor force growth. The bigger concern, however, is the reduced participation in younger workers, which has seen an outright decline in the number of individuals that are part of the workforce. On the other hand, prime age workers (25–54-years-old) have continued to participate at historical rates and have helped to partially offset the decline in participation rates seen in other groups.
Panel 1:
Labor Force Declines Are Driven by Younger and Older Workers
Inflation
Inflation continued to dominate the economic narrative in May, with the headline Consumer Price Index (“CPI”) and PCE inflation reaching 3.8% year-over-year (“yoy”) each, the highest readings in three years. A firm reading in the Producer Price Index, which signaled increased passthrough of rising input prices to consumers and core PCE inflation – the Fed’s preferred inflation measure – exceeding core CPI by 55 bps has heightened inflation concerns and highlighted the tough path for the Fed to return inflation to its 2% target.
Financial Markets
Fixed income markets remained highly reactive to oil and ceasefire headlines throughout May, with Treasury yields experiencing a sharp selloff through mid-month before staging a meaningful rally in the final week and a half of May. The primary catalyst for the move higher in yields was the surge in oil prices tied to the U.S.-Iran conflict, which pushed breakeven inflation rates to their highest levels in over three years and prompted markets to fully price in a Fed rate hike by April 2027. Towards month end, growing optimism around a potential resolution to the conflict contributed to a meaningful decline in yield levels from their May 19th peaks, with the long end nearly fully retracing its earlier losses. The front end, however, retained more of its move, leaving the yield curve meaningfully flatter on the month. 2- and 5-year Treasury yields rose approximately 12 bps in May, while the 30-year yield ended the month up just 1 bp (see panel 2).
Panel 2:
U.S. Government Bond Yields Remain High Relative to Pre-War
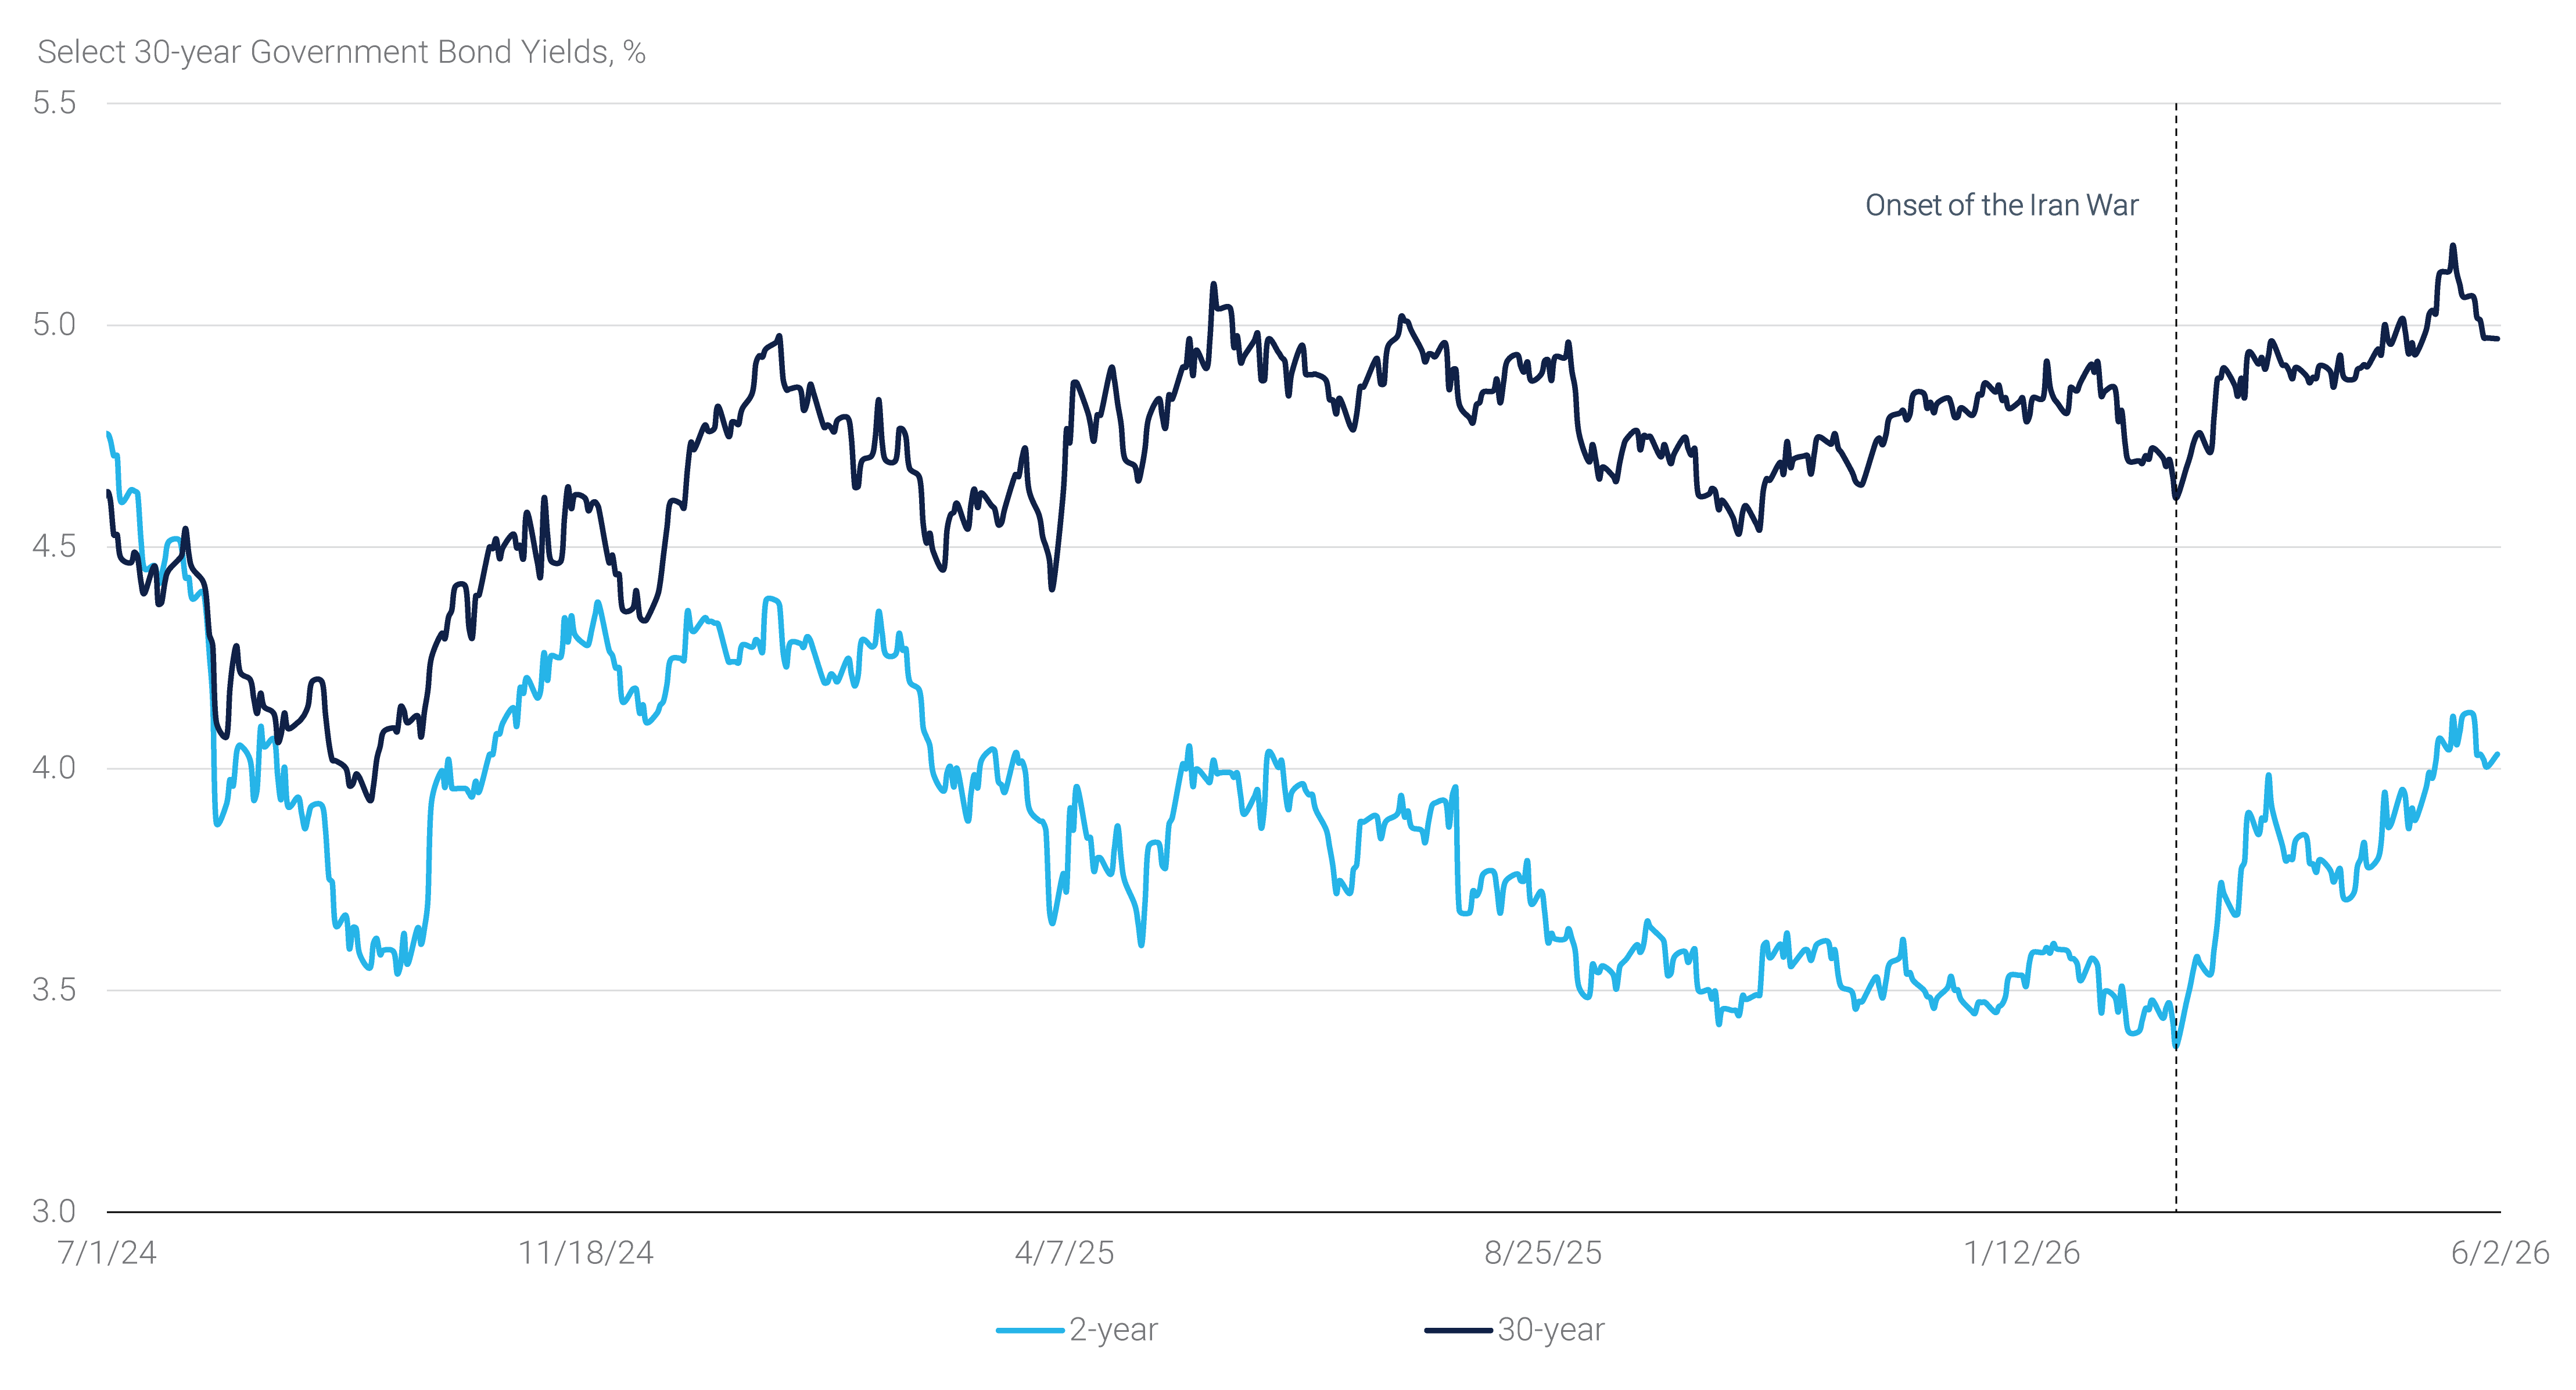
The May 19th peak in yields was driven in part by a wave of large block sales in U.S. Treasury futures that exacerbated the broader move and took the 30-year yield to 5.18%, its highest level since July 2007. The rapid nature of the selloff, with the 10-year yield rising 25 bps over the week leading into May 18th, is likely to have triggered some convexity-driven hedging activity, as the extension of the mortgage universe prompted servicers and portfolio managers to sell duration into an already pressured market.
Agency MBS and Risk Assets
Outside of interest rate markets, the Bloomberg U.S. MBS Index delivered modestly positive excess returns (+13 bps) in May, supported by continued healthy fixed income fund flows and a broadly stable rate-volatility backdrop. Implied interest rate volatility was little changed on net over the month, with the ICE Bank of America MOVE Index ending the month essentially at the same level as seen at the end of April. Moreover, realized volatility remained below implied volatility levels though the selloff in the middle of the month continued to pressure realized volatility somewhat higher. Taken together, these conditions were generally constructive for Agency MBS performance over the period, though Agency MBS once again underperformed corporate bonds, as the Bloomberg U.S. Corporate Bond Index delivered 56 bps of excess return in the month.
Meanwhile, risk assets posted accelerated gains, with the S&P 500 riding a 9-week winning streak, delivering a 5.3% total return in May. The second consecutive month of strong equity returns continued to be driven by A.I. optimism and robust earnings growth. Following the Q1 earnings season, Bloomberg tracking estimates suggest that S&P 500 companies will deliver a combined 22.4% growth in earnings per share in 2026, up from 16.5% earnings growth per share for the same period at the end of March. Both numbers are historically elevated and suggest that stock market gains were driven primarily by the bottom line rather than valuation gains. Moreover, expectations for 2027 earnings growth have been little revised and remain strong at 15% annual gains.
Rising Inflationary Risks
Inflation has accelerated in 2026 and is running hotter than at any point over the last three years, squeezing consumer purchasing power and amplifying the political “affordability” narrative. The acceleration in price pressures goes against earlier expectations for continued slowing in 2026, which was supposed to help bring inflation closer to the Fed’s 2% target after five consecutive years of elevated readings. However, Fed policymakers have sounded increasingly cautious as inflation stickiness, particularly in core services and select goods categories, leaves disinflation progress uneven, and vulnerable to upside surprises, making the “last mile” back to 2% difficult. As a result, the “vast majority” of Federal Open Market Committee (“FOMC”) members noted an increased risk that inflation would take longer to return to target than previously expected at their April policy setting meeting.(2)
Complicating matters, higher energy prices from the ongoing conflict in the Middle East are beginning to seep into other categories. Beyond prices at the pump, food inflation is set to increase later this year as transportation costs and other agriculture-related input prices rise, while a potentially negative impact from El Niño weather patterns may add to inflationary pressures. Core inflation may also get an uplift in the near term from higher airfares and high-tech goods related to intensifying demand from the A.I. buildout. While there appears to be broad agreement that the longer-run impact of A.I. is likely disinflationary through productivity gains, the near-term impulse reflects resource and capacity constraints related to the A.I. investment boom.
Panel 3:
The Path to Sub-3% Core PCE(3) Inflation by Year End Has Narrowed
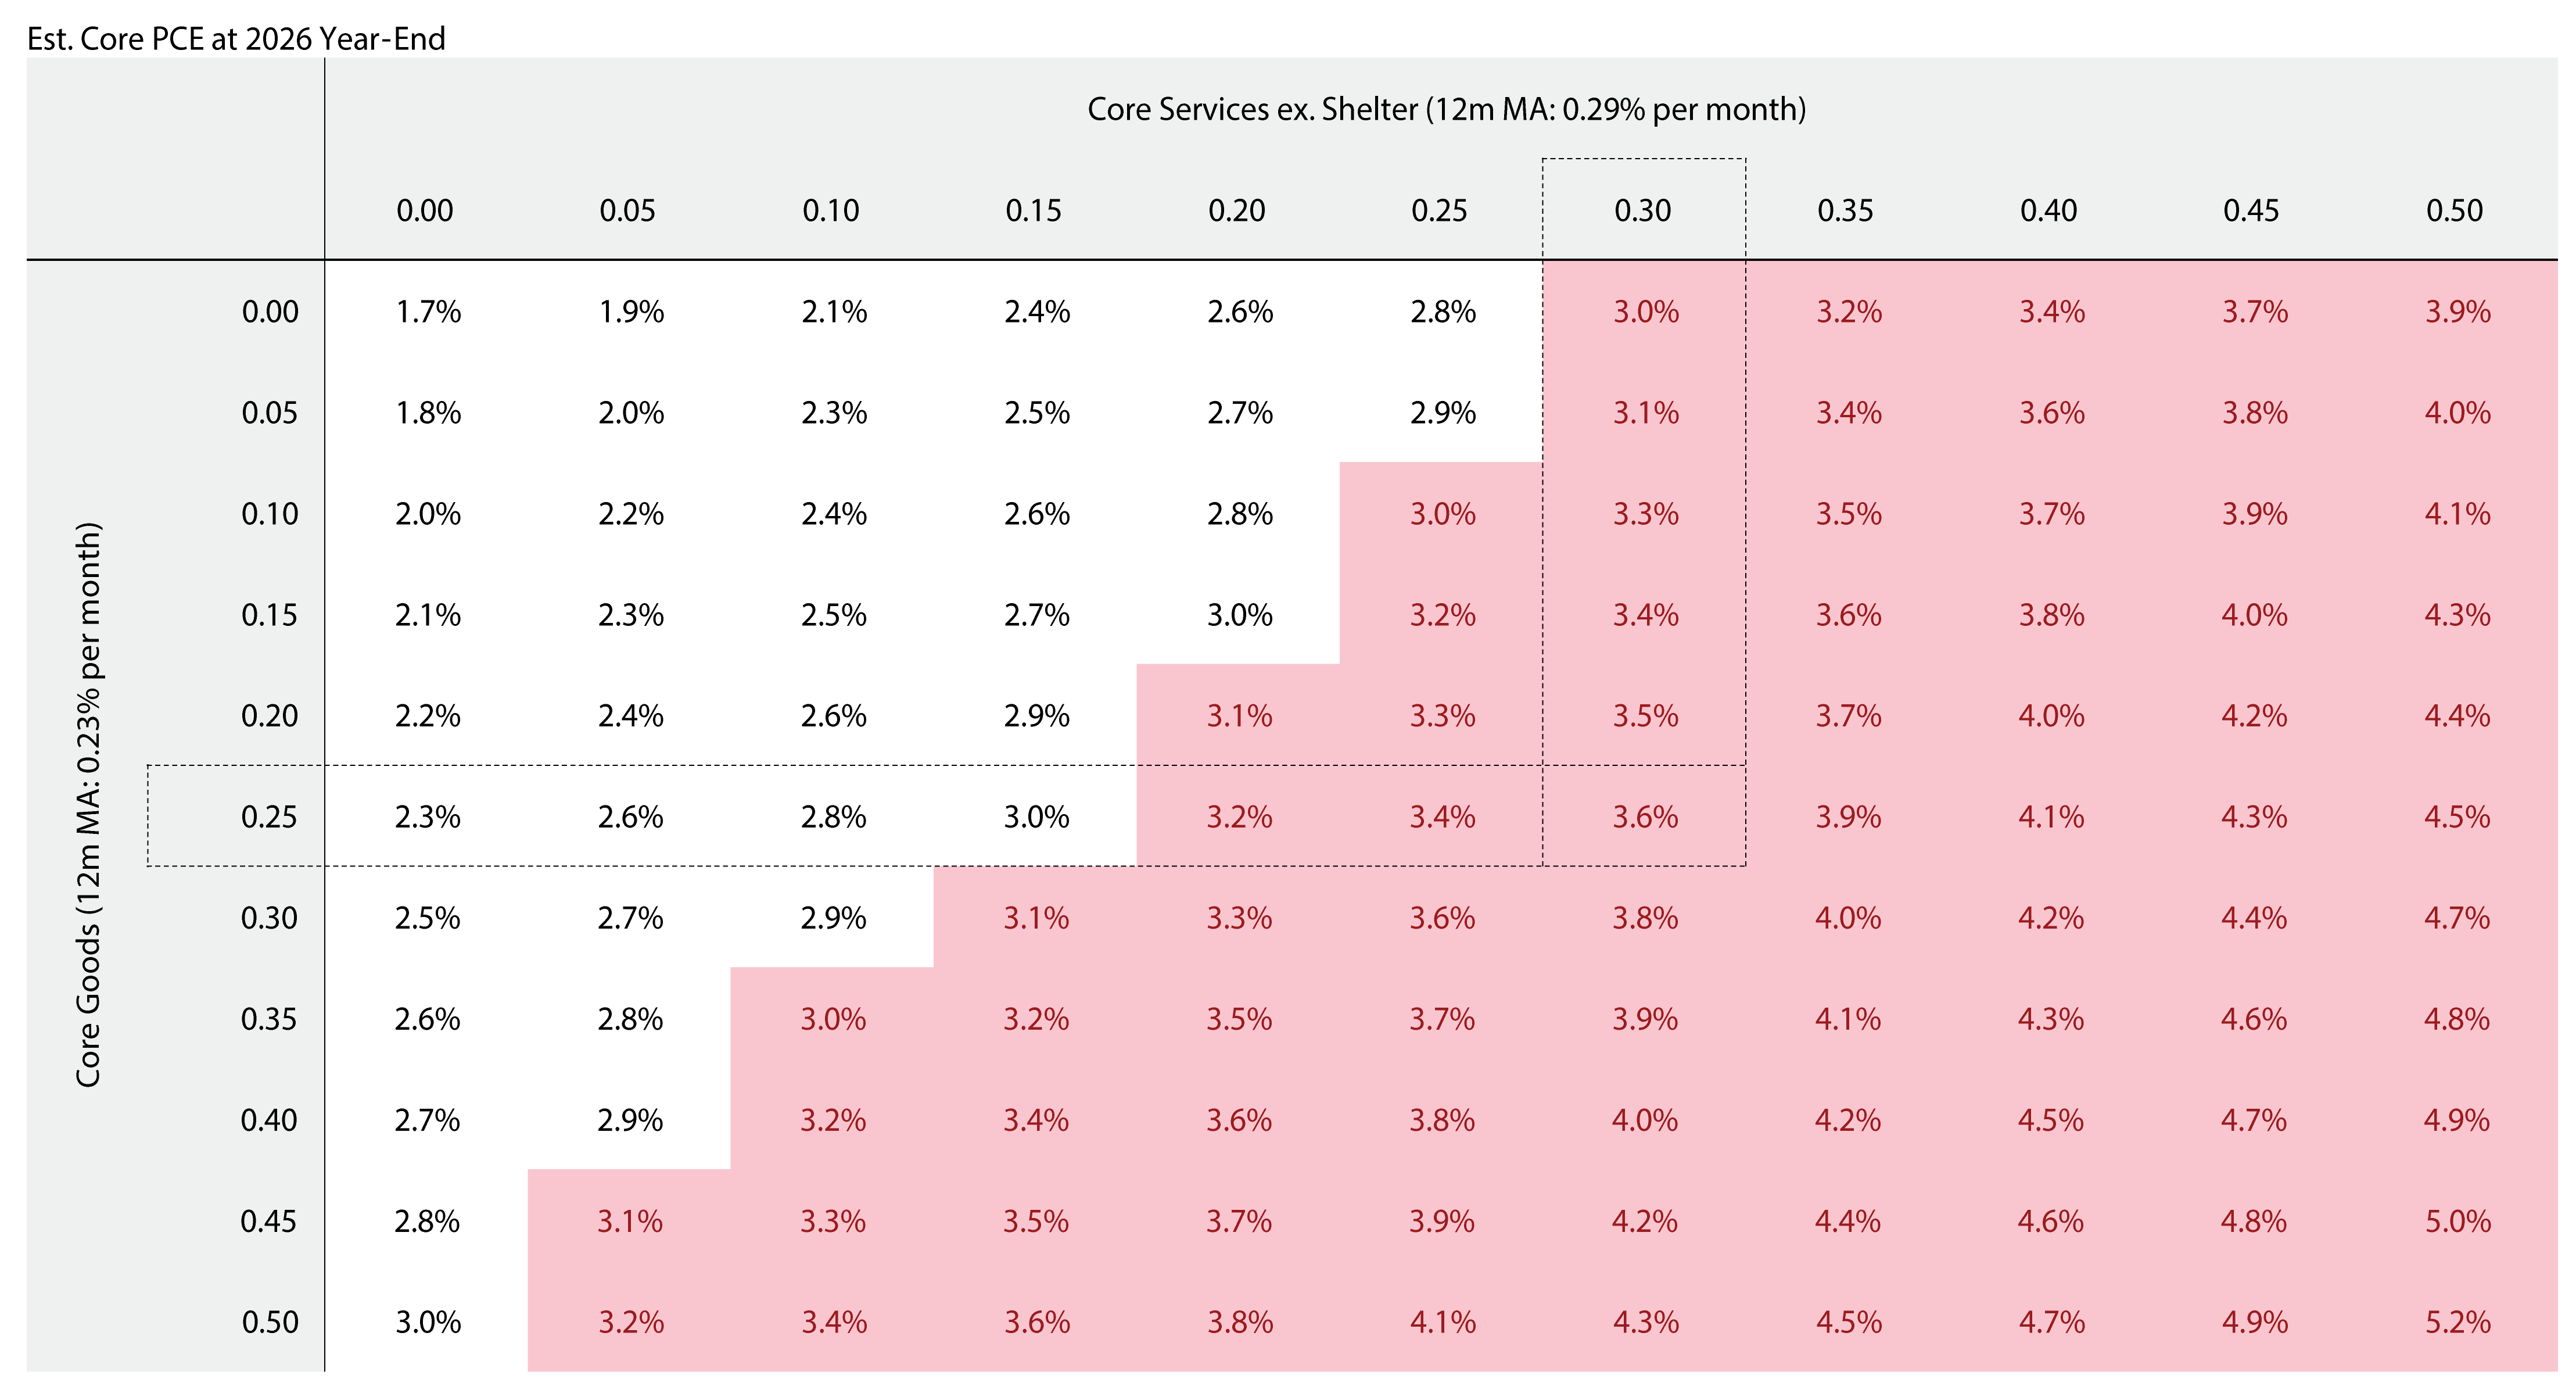
On the other hand, these pressures should be partly offset by continued cooling in shelter costs and a fading tariff passthrough. Despite this, core inflation is likely to have been firmer in May than it was in April, with risks skewing to the upside given the lagged impact of the energy price surge. With core PCE inflation now rising, the key question for Fed officials and the market more broadly has become: under what scenarios could inflation resume its disinflationary progress? As shown in panel 3, we estimate that the path to achieve a sub-3% rate of inflation has become increasingly narrow. For instance, should core goods, core services excluding shelter, and shelter inflation all continue to run at their 12-month moving average for the balance of the year, core PCE would rise to 3.6% by year end. Conversely, meaningful declines in either core goods or core services excluding shelter prices would be required to drop below 3%.
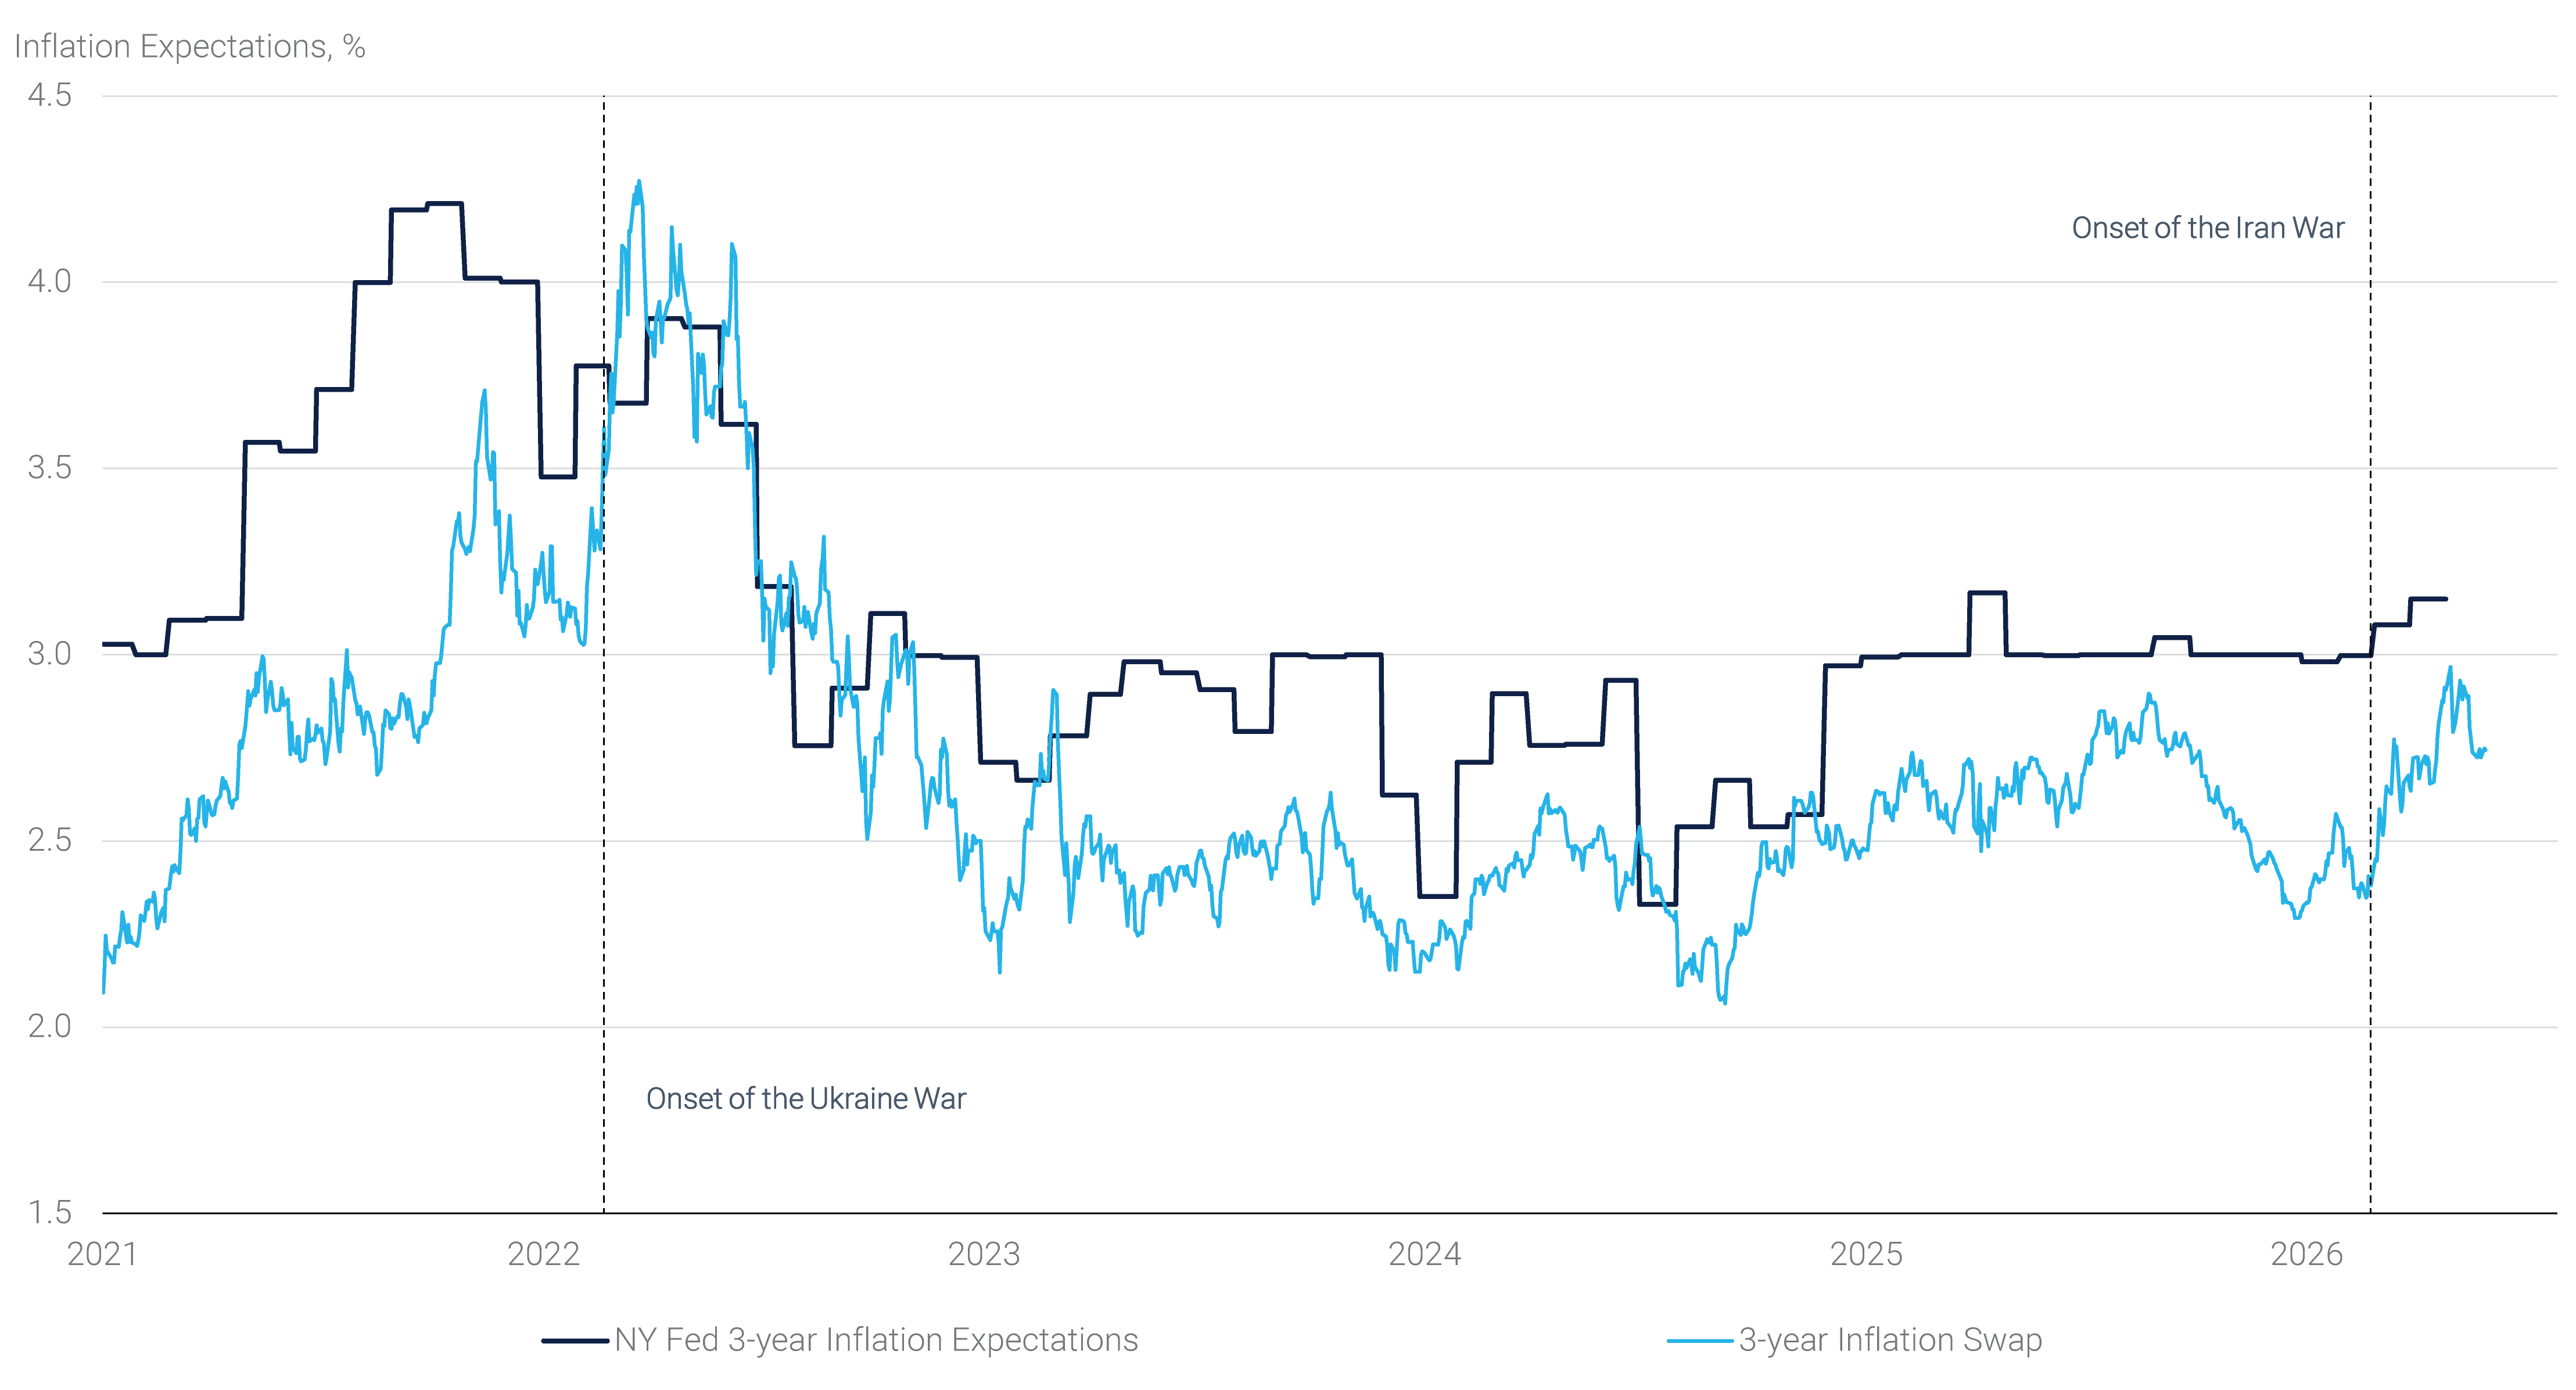
Consumer-based inflation expectations have edged higher since the onset of the conflict in the Middle East. For instance, according to the New York Fed’s Survey of Consumer Expectations, the median three-year forward expected inflation rate has gained 15 bps since February, rising to 3.15% as of April. Similar increases are present in the University of Michigan’s and the Conference Board’s consumer inflation expectation measures. Market-based inflation expectations have also risen modestly but remain well below the peaks seen in the first half of 2022, when the Fed was forced into an aggressive hiking cycle (see panel 4). This is likely a reflection that the current environment is still perceived as having less permanent inflation pressures than those present in 2022, when fast rising wages added to service sector inflation and kept consumers less price sensitive all else equal.
Panel 4:
Consumer and Market-Based Inflation Expectations Remain Relatively Anchored
That anchoring is helped by a market that has responded with a repricing of the expected policy path. With CPI at 3.8%, 1-year forward rates have shifted meaningfully higher across the entire term structure. The interest rate options market now implies a materially more hawkish regime than what was seen prior to the conflict: the probability of one-month SOFR for December 2026 exceeding 3.75%, the current top of the Fed funds target range, has surged from zero to roughly one in three, while the probability of exceeding 4% has risen from zero to nearly one in ten. Near-term rate cuts have been effectively ruled out, with the risk tilting increasingly toward a tightening cycle, a view that is internally consistent with forward inflation expectations remaining as contained as they are.
The outlook for the yield curve depends on how the growth backdrop evolves from here. Should hikes be delivered into slowing activity, the intermediate sector and long end would likely rally as markets re-anchor their estimates of trend growth and the neutral rate to lower levels, in turn flattening the yield curve. Continued economic resilience, by contrast, would push long-end yields higher even absent additional hikes, as neutral rate estimates are revised upward and the curve steepens. Either way, the current pricing carries real two-sided risk. Should the Fed hesitate, inflation expectations could reprice materially higher. Conversely, should inflation prove more transitory than the current run-rate implies, the hawkish policy path priced into the short-term interest rates would need to be reassessed. Both scenarios represent a meaningful shift from where markets are today.
Taken together, disinflation progress has stalled, the near-term inflation floor has risen, and the energy shock has introduced new cyclical pressures that are still working their way through the economy. Markets have responded not with alarm, but with a deliberate repricing of the policy path that keeps longer-term inflation expectations anchored so long as the Fed signals a slightly hawkish posture. The June FOMC meeting will be an important test of that assumption, with the March SEP projections likely to be revised higher and new Chair Kevin Warsh facing pressure to signal a patient stance reflective of higher inflation risks. For now, we believe that the key risk is not a re-acceleration to 2022-style inflation, but rather inflation settling into a higher plateau for longer than either consumers or policymakers had hoped, with episodic upside shocks complicating a smooth return to the 2% target. This keeps both the Fed and markets in a difficult balancing act for the remainder of 2026.