Economic data received in July continued to support a narrative of a durable expansion. While concerns surrounding inflation and elevated interest rates remain at the forefront of policy discussions, the underlying economy has thus far demonstrated a notable ability to absorb these headwinds. Altogether, real activity indicators improved as consumer spending recovered after a weak first quarter while non-residential investment continued to provide meaningful support to aggregate demand. That said, as we entered the second half of 2026, the sustainability of consumer demand and pricing pressures associated with the AI buildout will likely remain key areas to watch.
Economic Growth
According to the initial estimate from the Bureau of Economic Analysis (“BEA”), the U.S. economy expanded by 1.5% seasonally adjusted annualized growth rate (“SAAR”) in Q2 2026, a stepdown from the 2.1% SAAR achieved in Q1. Nonetheless, the underlying growth trend was much better than the headline implied as real final sales to private domestic purchasers – economic activity by the domestic private sector – accelerated to 3.9% SAAR, the highest growth pace since Q1 2023. Of note, consumer spending rebounded sharply, coming in at 3.2% SAAR after having slowed to 0.5% SAAR in Q1. Meanwhile, tech investment contribution dropped in real terms, likely driven in part by higher tech equipment prices and by the sharp rise in semiconductor imports offsetting investment. Therefore, while AI remains a dominant force in economic activity, growth outside those sectors appears to have broadened in Q2. Lastly, inventories, net trade, and government spending were all a drag on Q2 GDP growth.
Inflation
Inflation remained the dominant macroeconomic story in July. The June Consumer Price Index (“CPI”) and Producer Price Index (“PPI”) reports were much better than expected and some categories showed signs of moderation. In addition, the June core Personal Consumption Expenditures (“PCE”) index also surprised to the downside driven by soft monthly gains in core services prices – a welcome development for policymakers. Nonetheless, the magnitude of the surprise in the CPI and PPI reports raised the possibility of those reports offering more noise than signal, especially considering that the overall trend as measured by the annual rate of inflation – at least in the traditional inflation measures – is still one of persistent inflation rather than a convincing return to the Fed's inflation objective (see panel 1).
Panel 1:
Core Inflation Remains Elevated
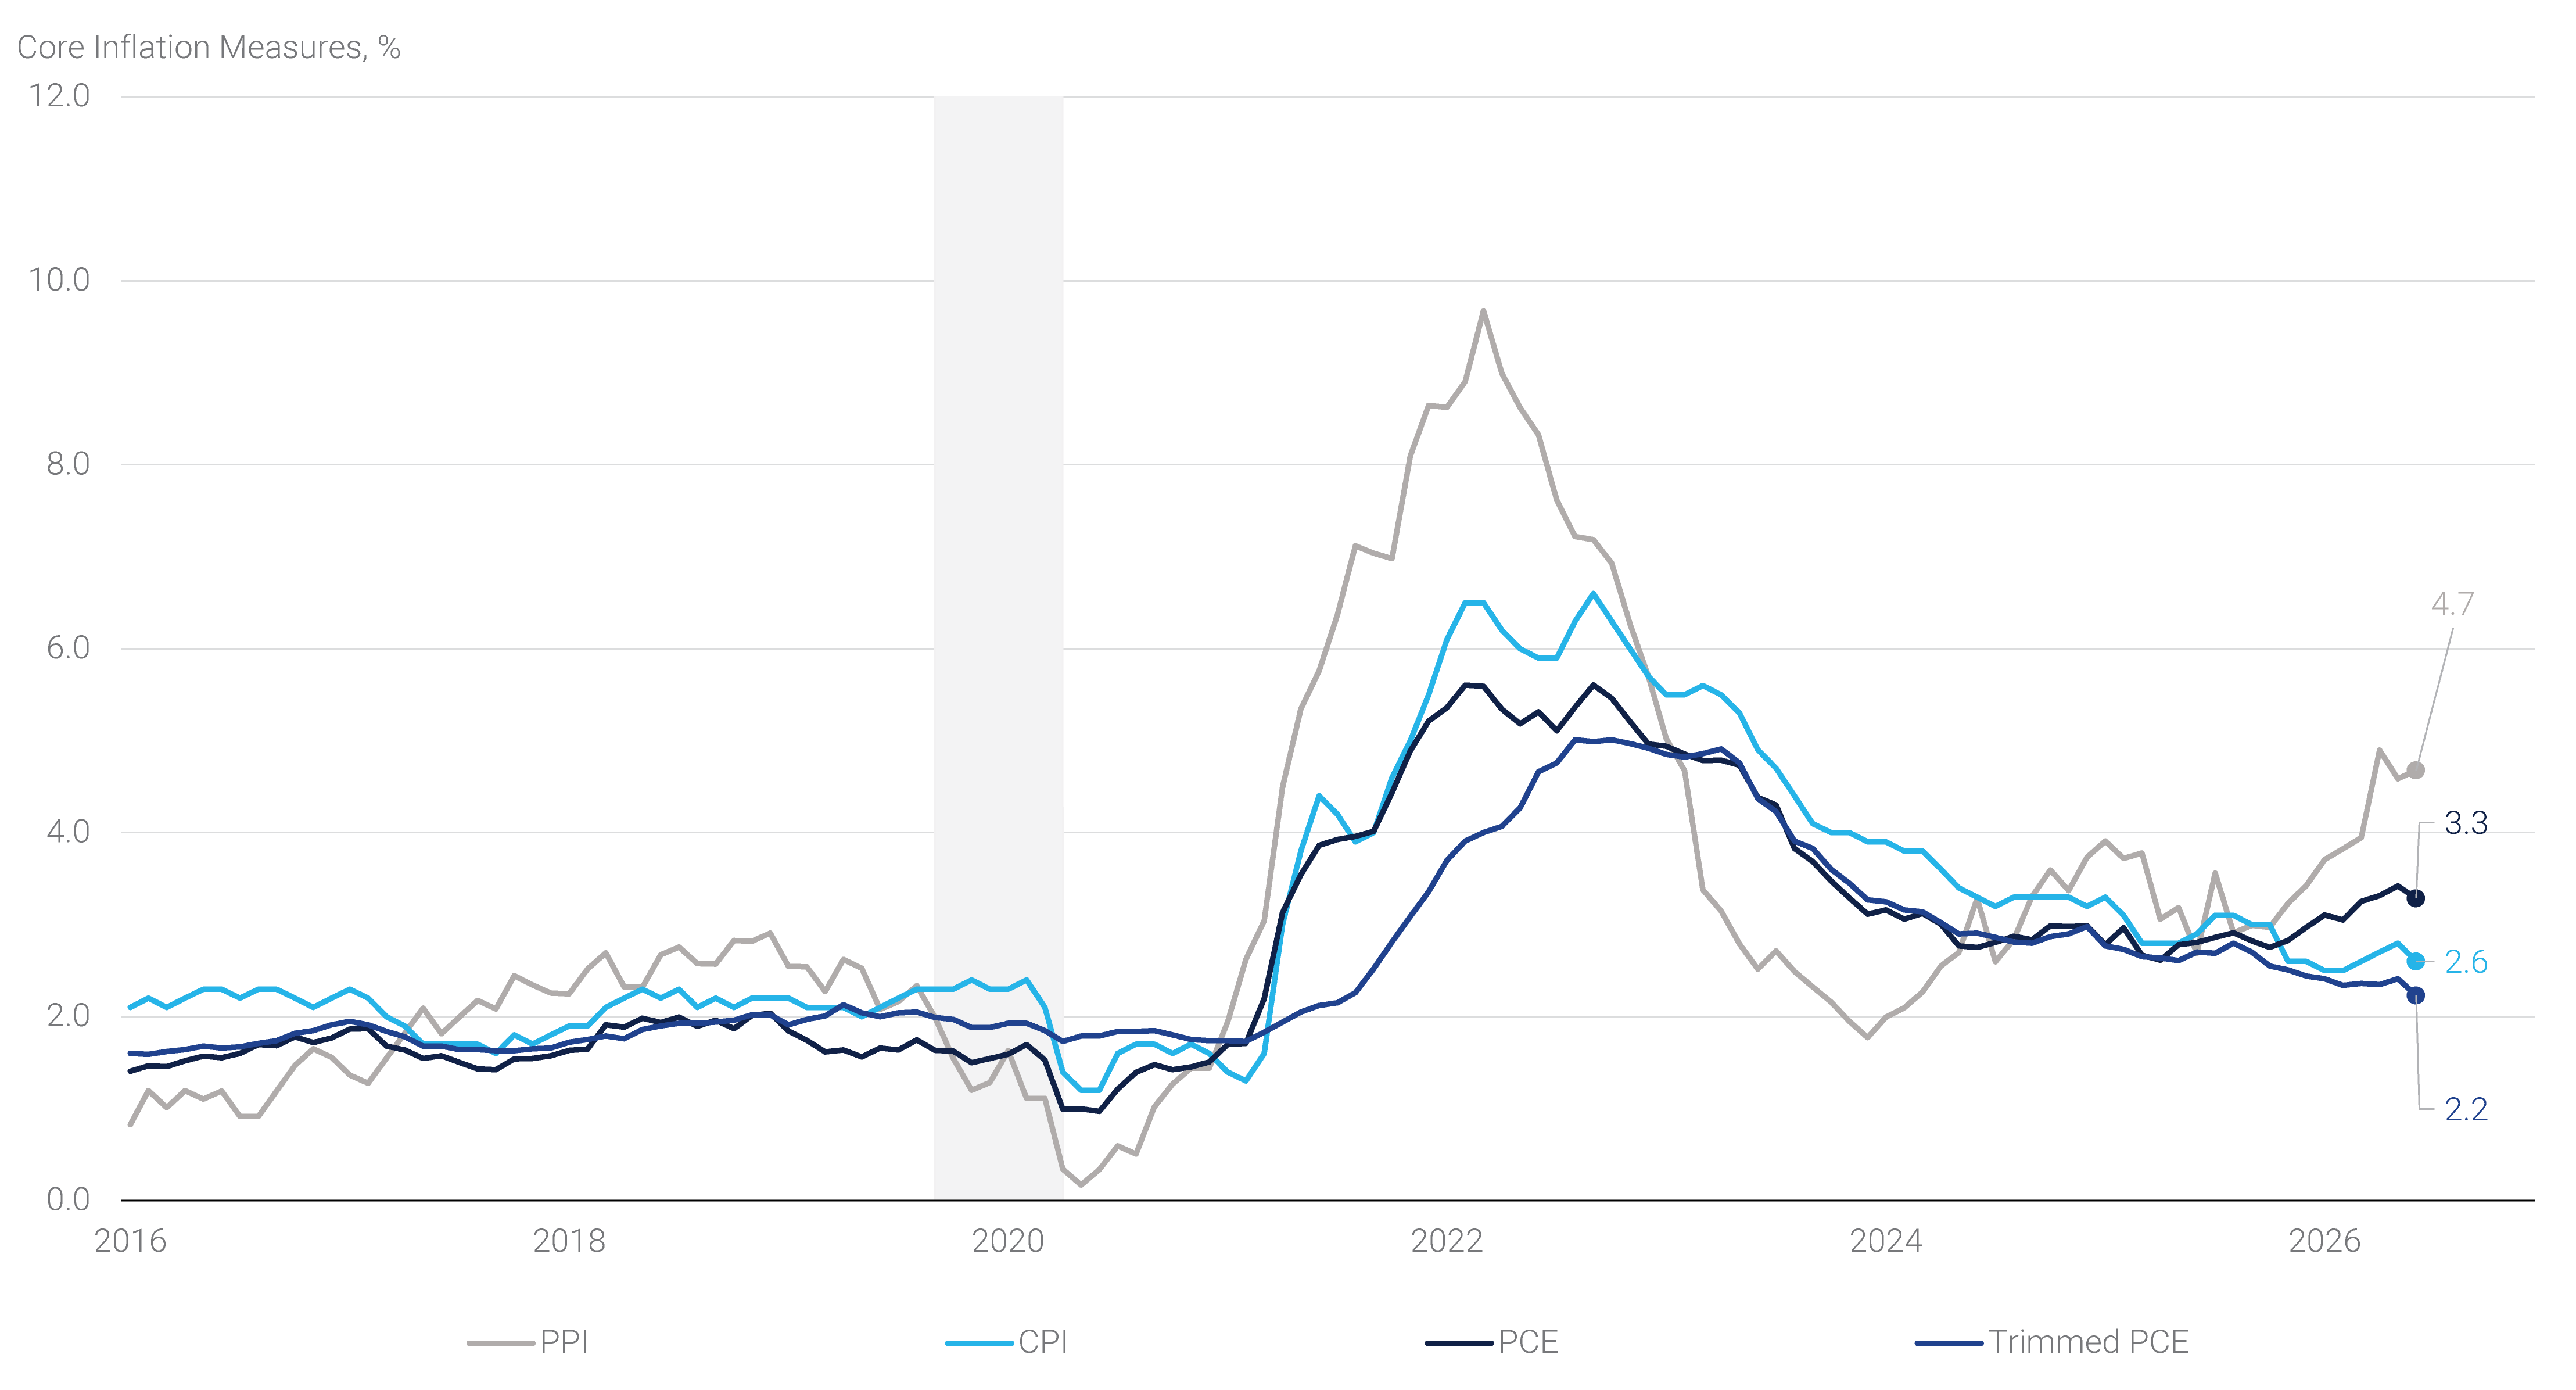
The encouraging news was that some of the inflationary pressures that dominated earlier in the year appeared to be easing. Energy-related second-round effects moderated and tariff-related pass-through to consumer prices looked increasingly mature. Moreover, the share of PCE components for which prices grew between 0 and 2% rose to 24% in June after reaching 10% in March while the share of components experiencing price increases above 2% dropped to 48% – the lowest share since November 2025.
That said, elevated inflation levels do not appear to be solely an energy story. While elevated commodity prices continue to influence the outlook, persistently elevated core services inflation and strong demand in select areas of the economy continue to contribute to above-target readings and prevent a meaningful decline in core inflation measures. Meanwhile, a fluid situation in the Middle East and the rollout of a new set of tariffs by the Administration add further uncertainty to the outlook. As a result, we believe that the data received in July did little to materially change the policy outlook with policymakers likely to maintain a cautious stance and remain focused on upside inflation risks.
Labor Market
Labor market data received during July continued to support the characterization of a healthy employment picture. Payroll growth remains positive, jobless claims are contained, and separations remain historically low. These factors are all consistent with a labor market that has moved closer to balance. While employers have become more selective in their hiring plans and generally appear reluctant to add workers aggressively, they remain equally reluctant to reduce headcount. This environment has kept unemployment relatively stable (4.2% as of June) while limiting the risk of a sharp deterioration in labor market conditions as drops in employment have been more than offset by decreases in the labor force according to the household survey. Furthermore, the labor market appears sufficiently strong to support modest income growth and continued consumer spending. For policymakers, this remains an attractive state, as a stable labor market reduces recession risks while helping prevent the type of wage pressures that contributed to inflationary concerns during the post-pandemic expansion.
Financial Markets
Financial markets were driven by three interrelated themes in July: a) the re-escalation of the conflict between the U.S. and Iran, which temporarily pushed oil prices back above $100 a barrel; b) the July Federal Open Market Committee (“FOMC”) meeting, where markets were unconvinced by Fed Chair Warsh’s explanation of the Committee’s decision to remain on hold, which prompted what we would characterize as an inflation credibility shock; and c) a sharp unwind in the AI-driven momentum trade that added to broader risk-off sentiment. Aspects of all three themes were visible across fixed income, currency, and equity markets.
The war premium that markets had spent two months unwinding came back in July. Hostilities spread from the Strait of Hormuz to the Red Sea over the course of the month, and Brent crude briefly broke above $100 a barrel in late July for the first time since May, unwinding much of the normalization seen following the signing of the Memorandum of Understanding. The oil shock brought Treasury yields back to their yearly highs and reintroduced the upside inflation risks that had appeared to be fading in June.
The most notable move in interest rate markets was a significant bear steepening of the yield curve, with long-end yields rising sharply. The 30-year Treasury yield surged more than 25 basis points ("bps") on the month to reach 5.27%, surpassing its May peak to reach the highest level since 2007. The 2-year/10-year Treasury curve steepened 15 bps, reversing the flattening momentum that had been in place since the onset of the conflict. Notably, the selloff did not reflect a repricing of the expected policy path: market pricing for rate hikes in 2026 and 2027 was little changed on the month at 31 bps and 16 bps, respectively. Instead, 5-year 5-year forward inflation swaps rose sharply while front-end real rates declined into month-end, suggesting that markets are questioning the Fed's resolve to fight inflation rather than pricing more action (see panel 2).
Panel 2:
A Fed on Hold Is Testing Its Inflation-Fighting Credibility
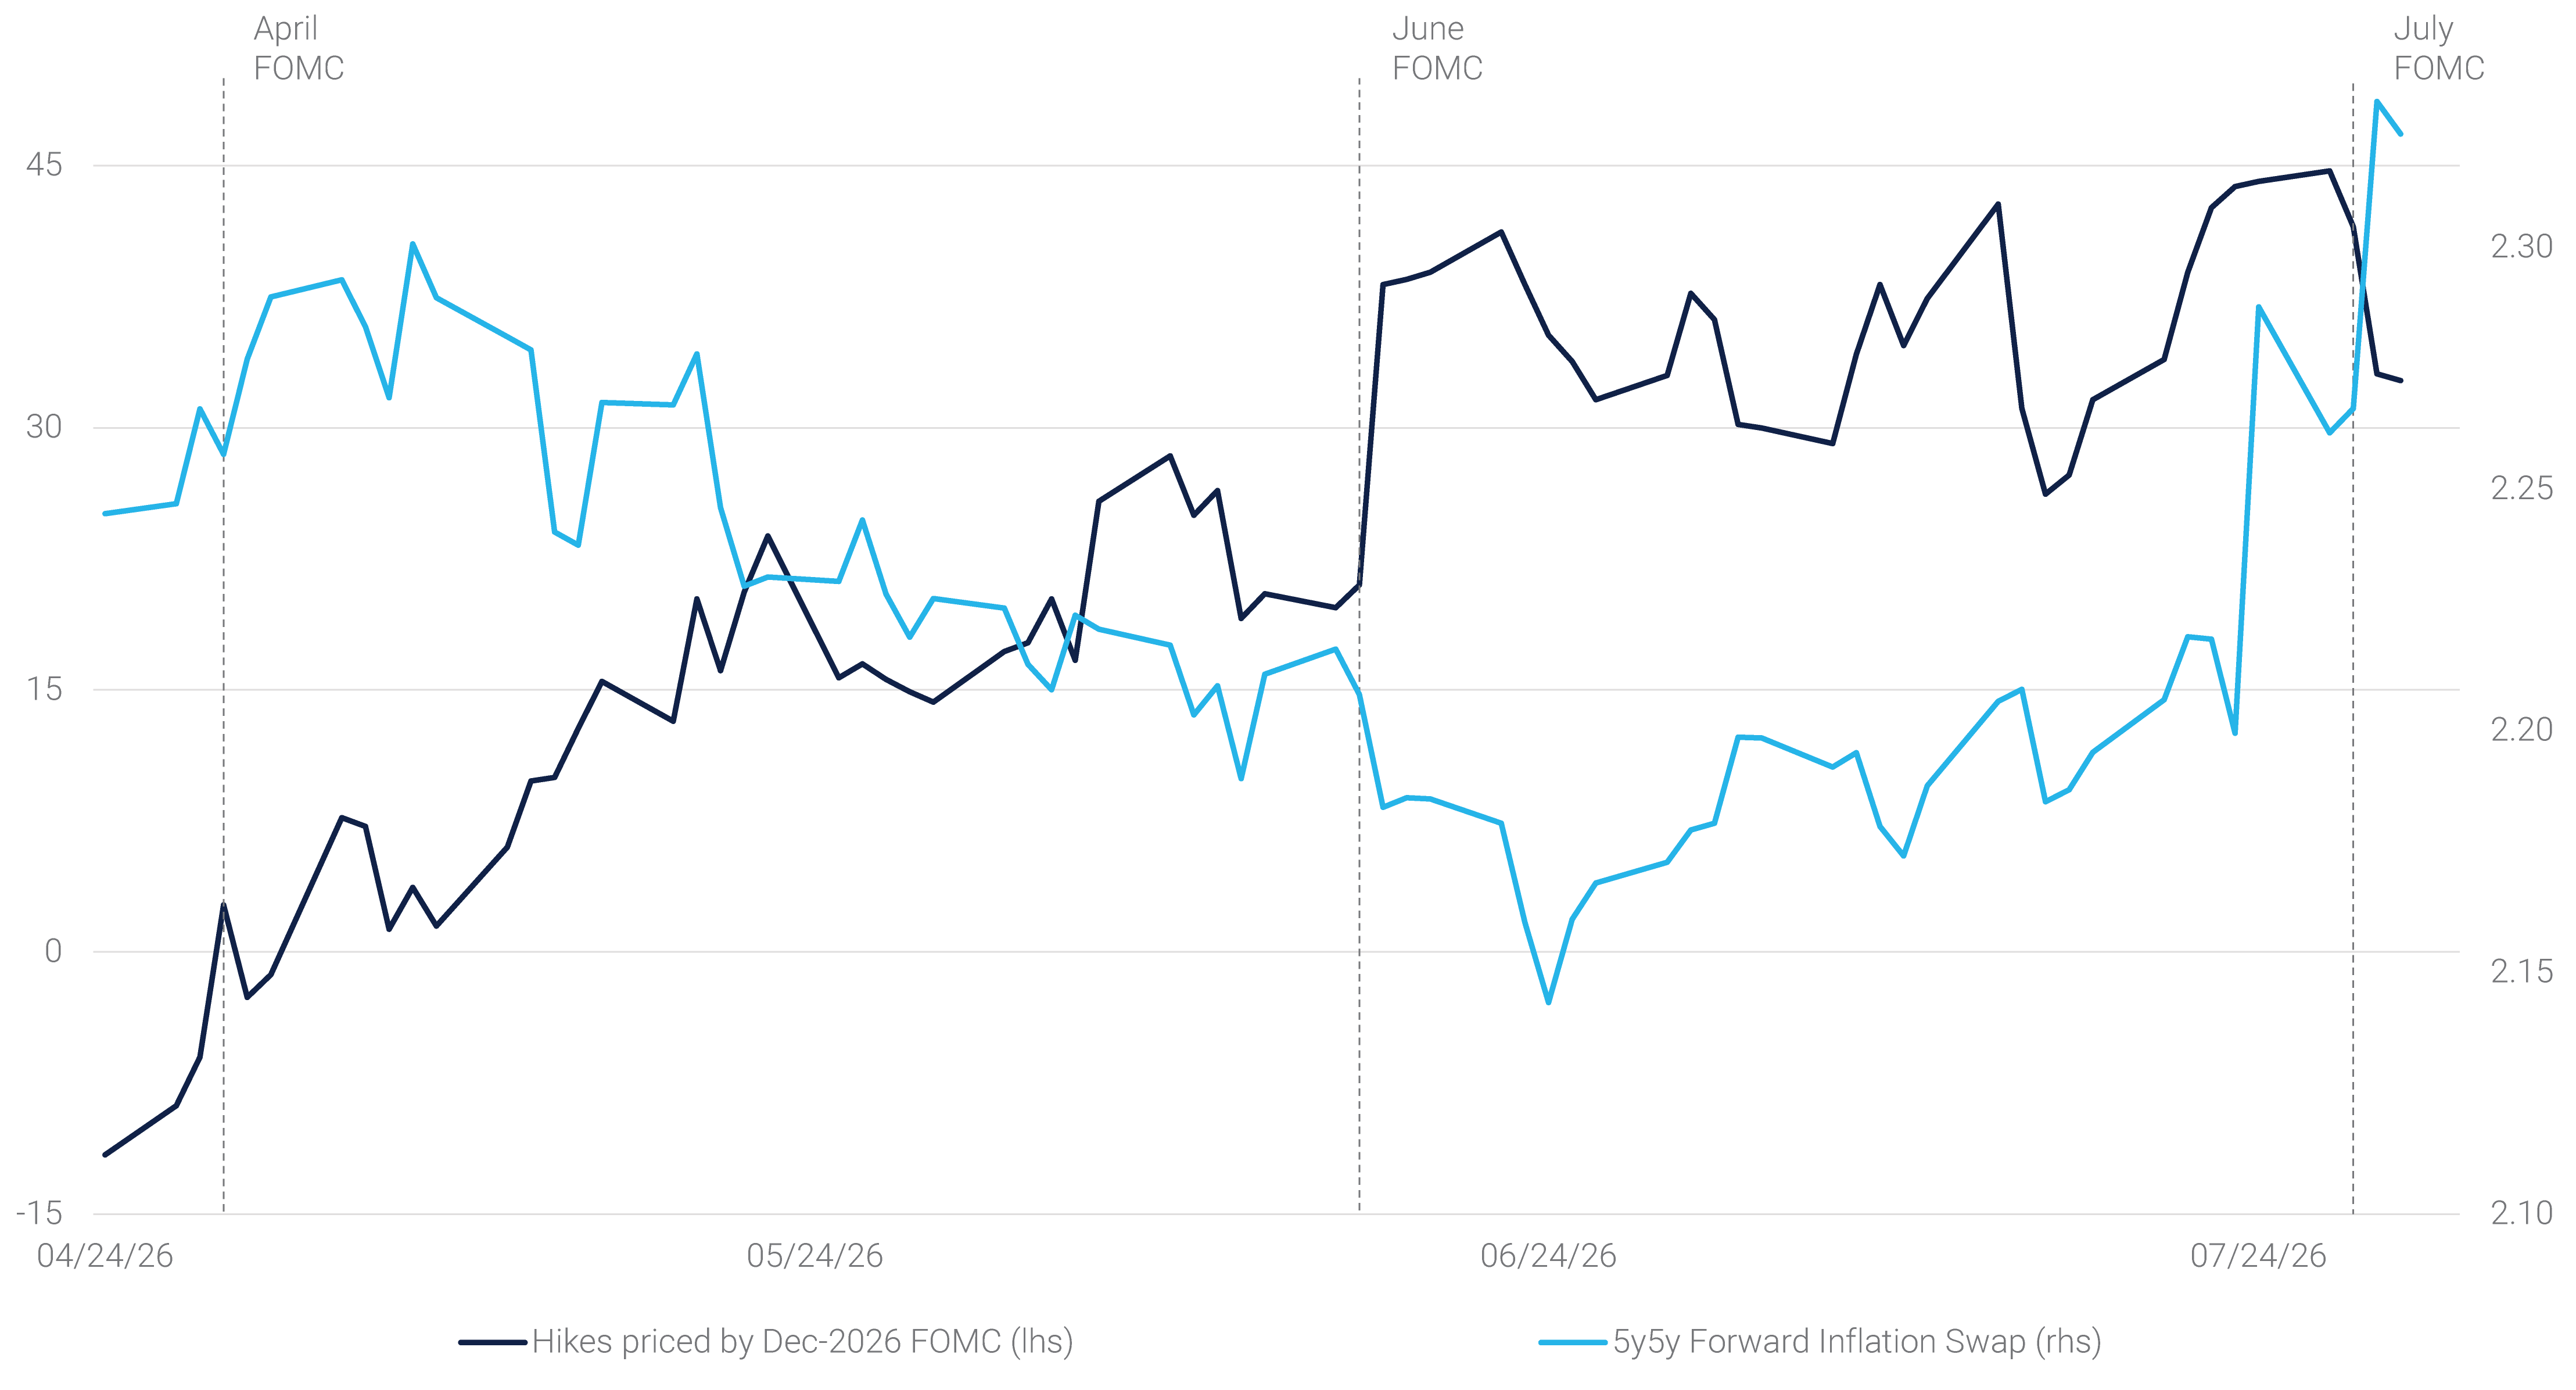
The July FOMC made that tension explicit. The Fed held the target range unchanged for a fifth consecutive meeting on July 29. The decision itself was expected by a majority of Fed watchers, but the market reaction was sharp, with long-end yields surging to fresh multi-decade highs. Three policymakers dissented in favor of tighter policy, underscoring pressure within the FOMC toward hikes. Chair Warsh maintained his hawkish rhetoric, stating the Fed has "no tolerance" for persistently high inflation, but argued that elevated market rates are already doing some of the Fed's work — an argument that hinges on market confidence in the Fed's willingness to act. The market response was consistent with a central bank credibility shock, as Treasury curves sharply twist steepened, inflation expectations jumped, and equities declined. If incoming data remains solid in coming months, we believe that these credibility concerns are likely to meaningfully increase pressure on the Fed to tighten.
Agency MBS and Risk Assets
Agency MBS came under pressure in July, with the Bloomberg US MBS Index delivering negative 44 bps of excess return, underperforming corporate credit, which returned negative 26 bps of excess return. The weakness was heavily concentrated in the final sessions of the month, as the post-FOMC surge in long-end yields and interest rate volatility hit the most convexity-exposed sector of the fixed income market hardest. Underperformance spanned across the coupon stack, with belly coupons most exposed to the rise in volatility and higher coupons pressured by extension concerns and a pickup in supply.
Importantly, we view the underperformance as a rates and volatility phenomenon rather than a reassessment of the asset class. Corporate credit spreads widened on a repricing of credit risk amid geopolitical uncertainty and a supply-heavy issuance calendar; Agency MBS weakness, by contrast, largely reflected the mechanical toll of a sharp bear steepening and higher implied volatility on a negatively convex asset, with demand technicals remaining intact throughout the selloff. With spreads now at wider levels, we believe Agency MBS valuations have become more compelling, and the sector is well positioned to recover should rate volatility subside from post-FOMC extremes.
Equity markets added to the risk-off tone amid a sharp unwind in AI momentum names. The S&P 500 momentum factor suffered one of its steepest three-week selloffs on record, with investors continuing to reassess the winners and losers of the AI capital expenditure cycle. The rotation contributed to broader risk-off momentum across asset classes into month-end.
Housing Market Update: Inventories are Stabilizing Across Regions
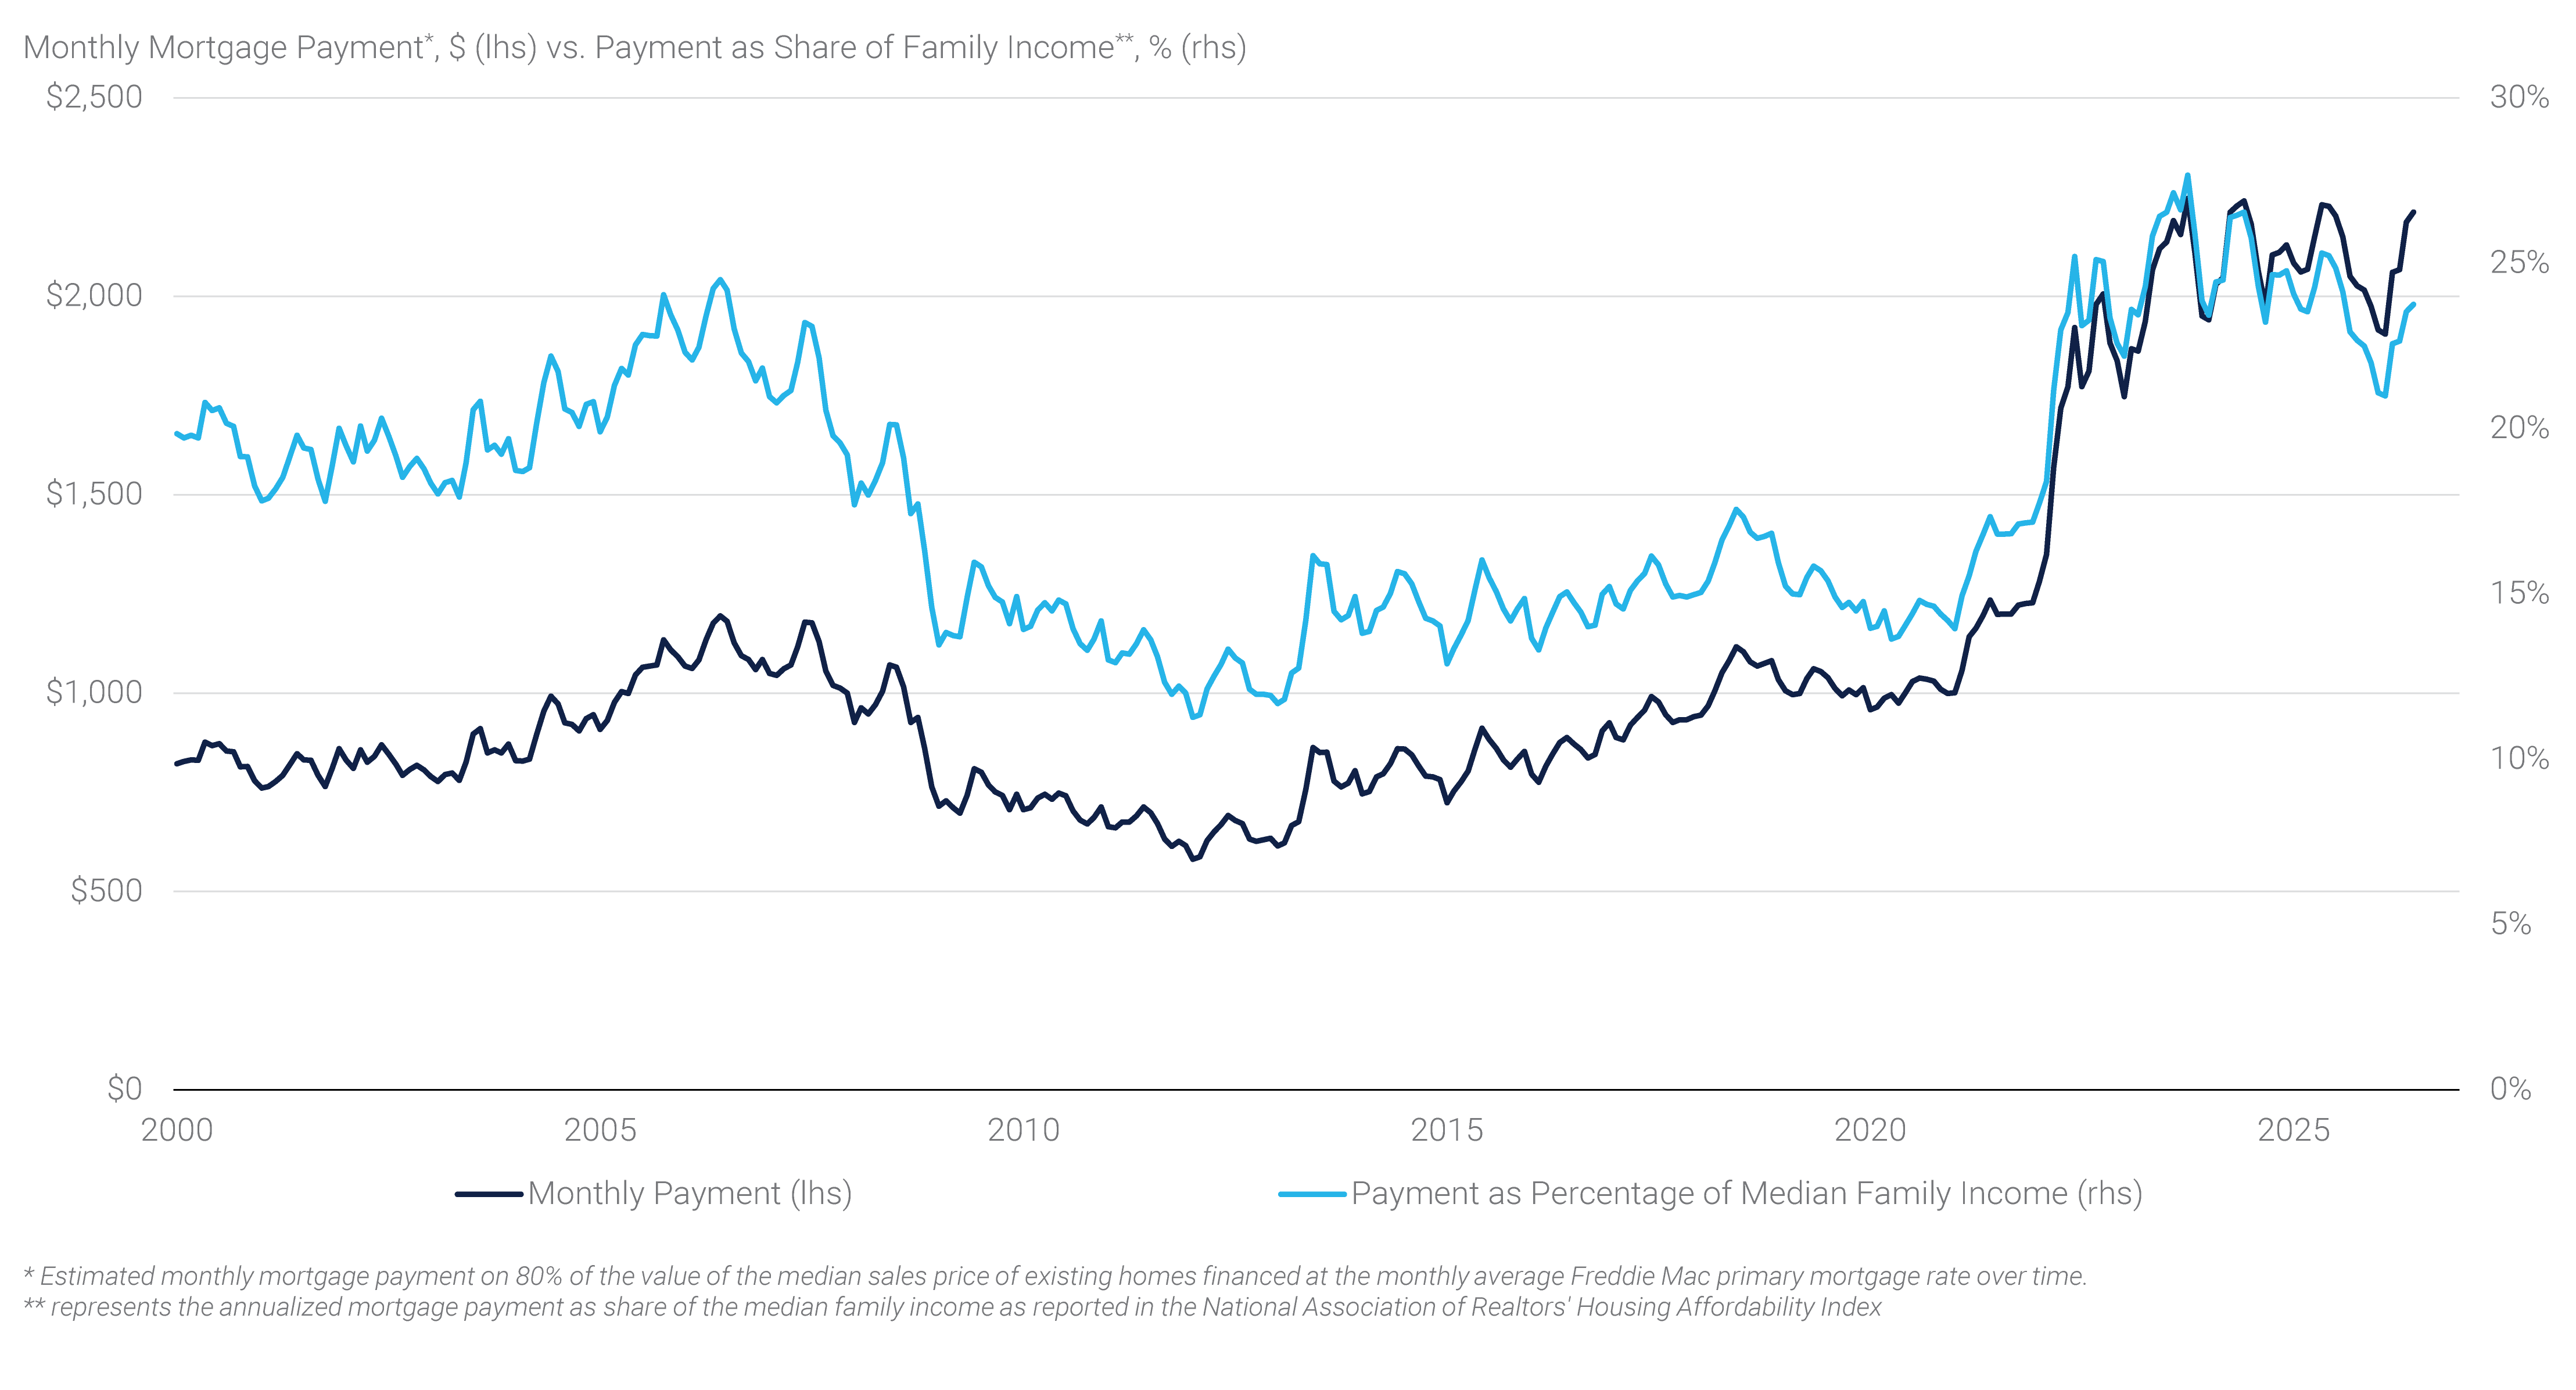
As the summer months mark the historical peak of the housing turnover season, this month’s note features an update on the state of the housing market. From a high level, little appears to have changed in aggregate for housing activity, which remains muted amidst ongoing affordability challenges (see panel 3). New and existing home sales have averaged a combined 4.7 million annualized units in 2026, roughly in line with the average of the prior three years, but well below the pandemic era peaks. The subdued activity results from a combination of persistently elevated mortgage rates given high long-term yields and sustained firm home price levels despite muted annual appreciation rates. The latest reading of Zillow data for June 2026 suggests that home prices have risen 1.1% year-over-year nationally, a continued soft reading. That said, home prices remain 50.9% above their 2019 averages nationally, while per capita nominal incomes are 41.5% higher over the same period.
Panel 3:
Housing Affordability Has Not Improved
Despite the relatively unchanged picture in aggregate, the housing market is changing on the margins. This is mainly visible in the regional bifurcation that has been evident in recent years. Recall that while national home prices have trended sideways – showing little price appreciation or decline – several regions underperformed the national picture. Cities and states that saw meaningful demographic inflows during the pandemic and responded with increased construction – like Phoenix, Austin, or Miami – saw prices deteriorate more significantly in recent months. Regions that have more limitations on new construction or that saw population outflows during the pandemic – typically cities in the Northeast or Midwest – have seen better price dynamics. Take for example Chicago and Phoenix: While Phoenix home prices are currently 11.5% below their all-time high from more than four years ago according to Zillow, Chicago prices continue to reach all-time highs and the city reports some of the strongest home price appreciation among any major city in the U.S. at the present. However, both cities show relatively similar aggregate home price growth since 2019, suggesting that the weakness in Phoenix has been in part a drawn-out correction.
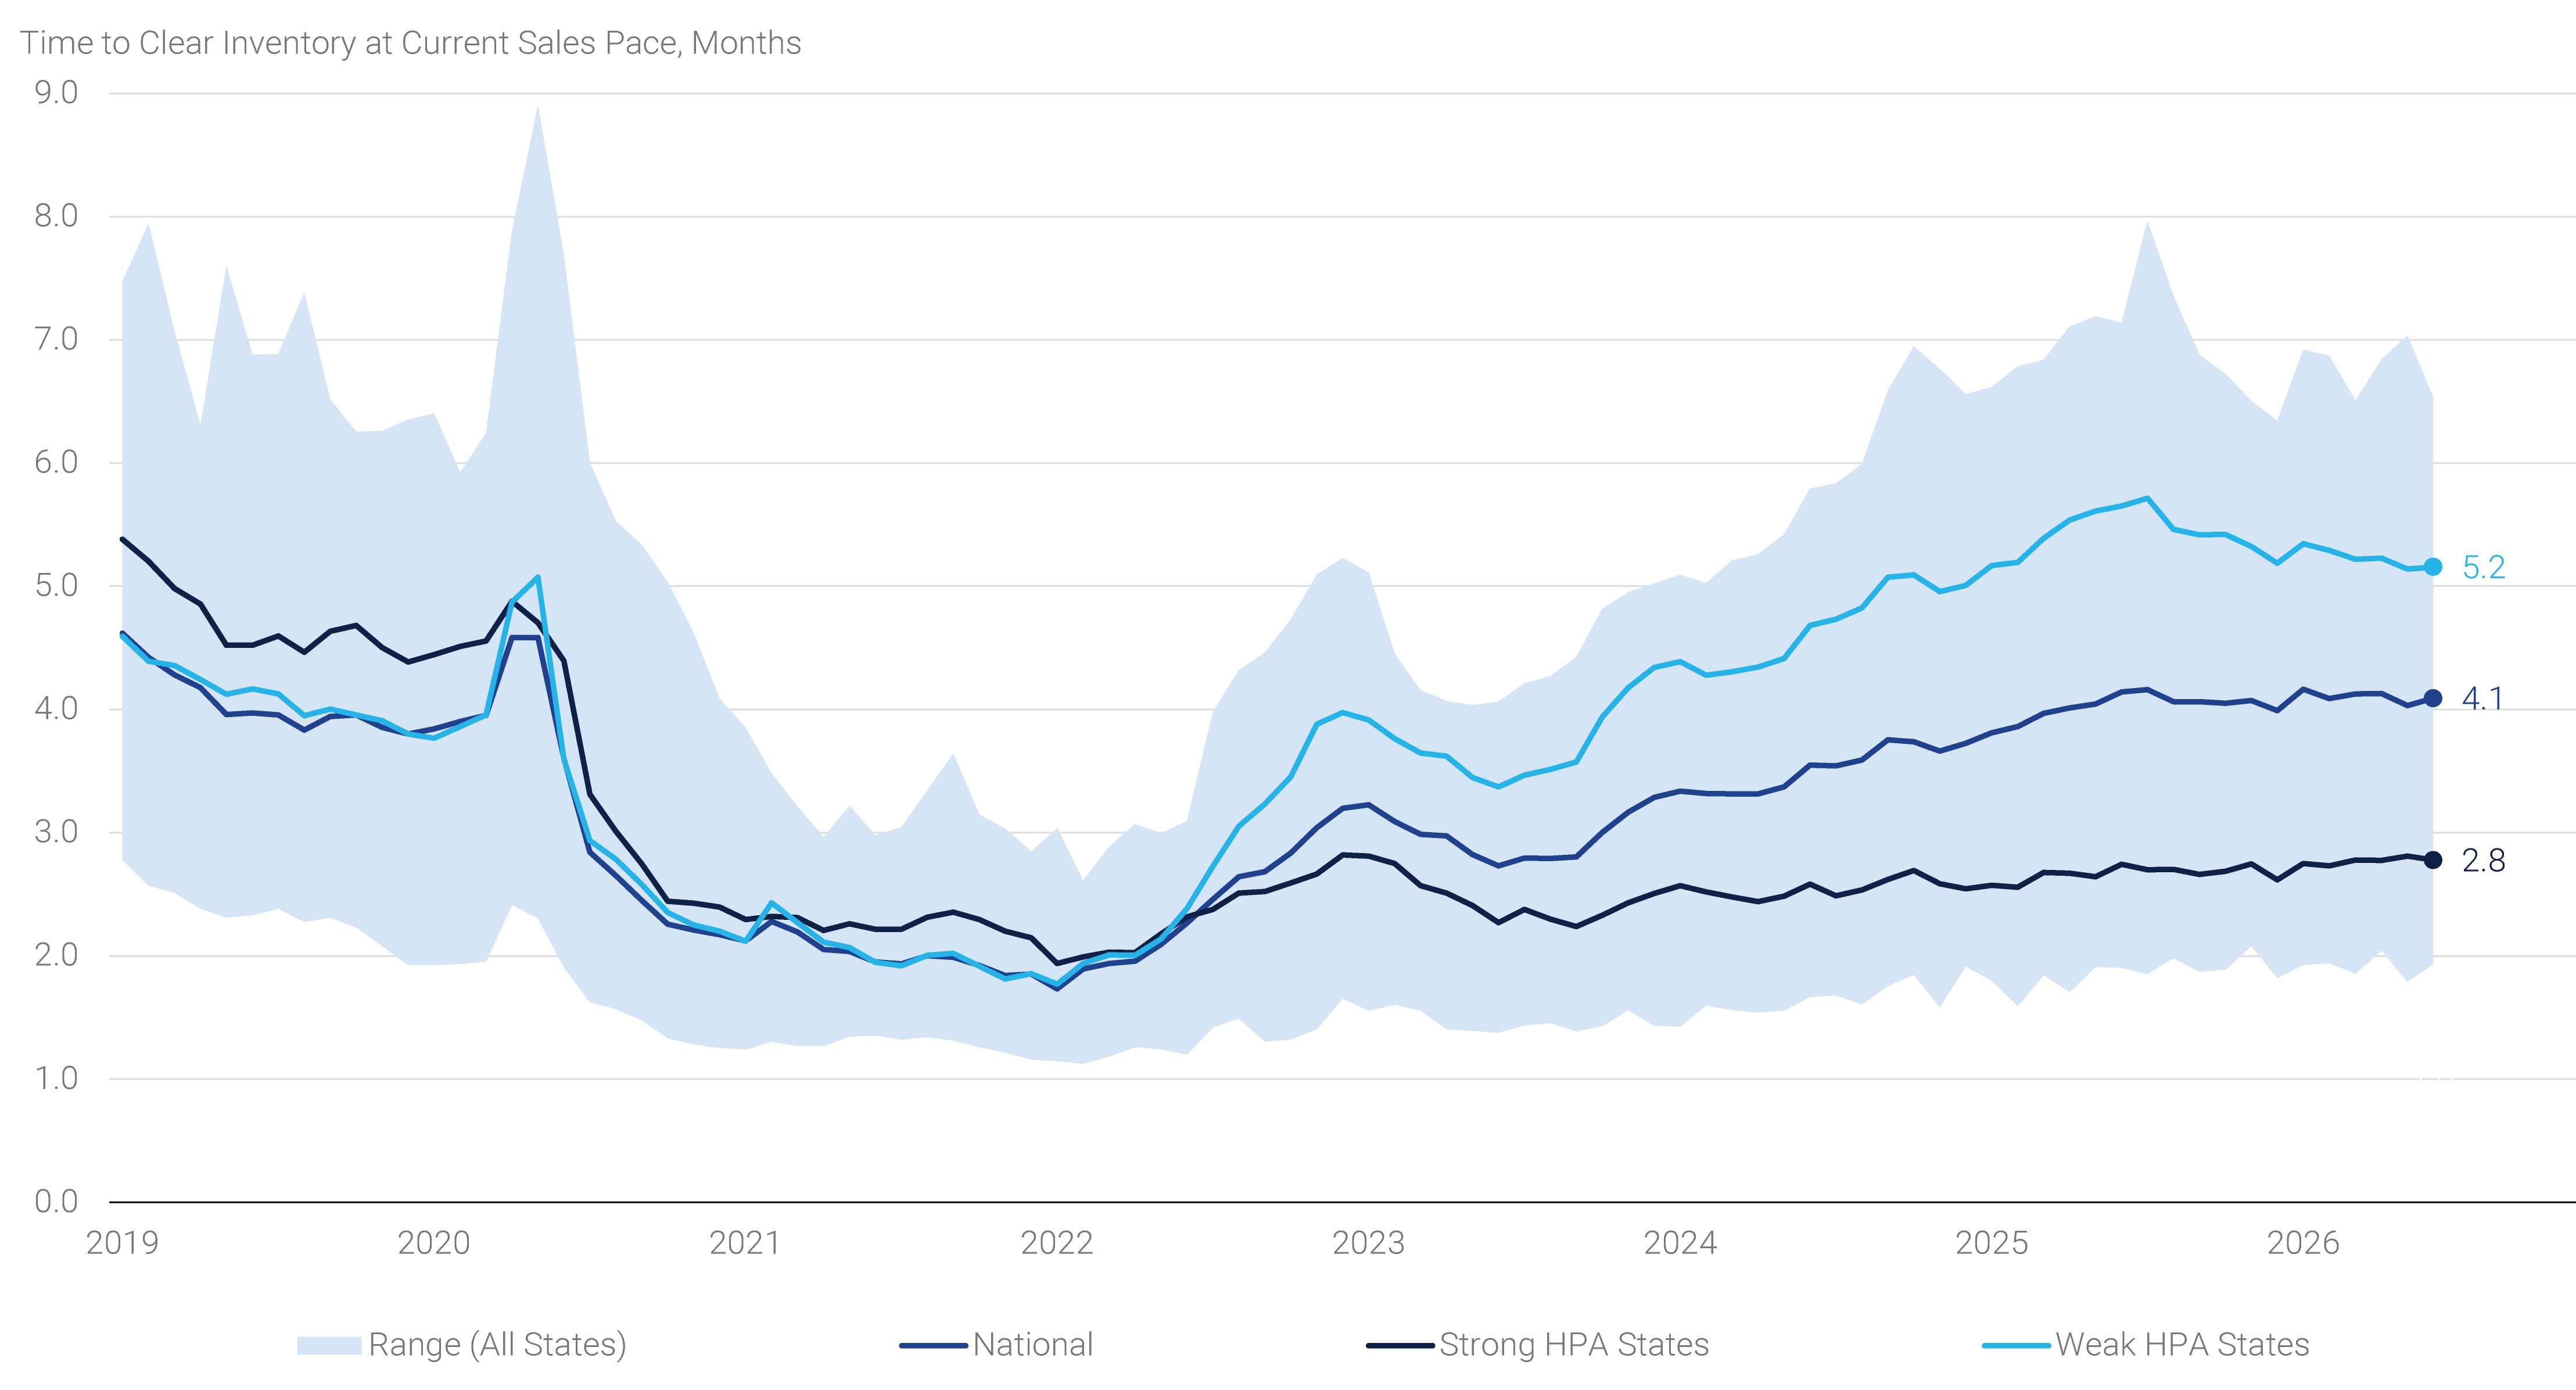
To gain insights into further price developments, it is important to look at the inventory dynamics across regions with different home price developments. Outside of an economic shock – such as higher unemployment – that changes housing market dynamics, inventory changes are the best indicator of coming price developments. In recent years, inventory levels rose relative to the pace of sales following the lull in 2022, when inventories were pressured by strong housing demand amid historically low interest rates. Inventories vis-à-vis sales subsequently normalized and are now comparable to 2019. However, the experience has differed across states, with states that saw the biggest increases in inventories seeing more substantial price weakness than states that saw more muted inventory increases.
Panel 4 visualizes this inventory dynamic. While showing the range of inventory to sales ratios, which we deemed time to clear inventory or essentially the inventory divided by monthly sales, the ratio is shown for the five states with the weakest average home price growth (“weak HPA states”) and the states with the strongest average home price growth (“strong HPA states”).(1) Weak HPA states saw significantly more growth in inventories from mid-2022 to mid-2025 than those that experienced strong HPA growth. This was likely a major contributor to the weaker price gains or modest home price depreciation. Important to note, however, the inventory buildup has begun to slow both nationally and in the weak HPA states, suggesting some price pressures could abate in these areas. While this analysis does not suggest a turning point for any regional housing market, similar inventory turnover experiences might lead to narrower regional disparities, though inventory levels in weak HPA states remain significantly higher than those with strong HPA.
For now, we believe that little is likely to change in the aggregate housing market until lower interest rates can improve affordability and increase turnover. We are encouraged by the recent passage of the 21st Century ROAD to Housing Act, which is a good initial step to address housing supply issues and may potentially improve affordability dynamics. However, we also view housing as a largely local issue, which suggests that the impact of federal laws and regulations could be more limited. For now, we remain in a market of low turnover, though there may be somewhat reduced bifurcation between weaker and strong regional markets in the near future.
Panel 4:
Inventory Levels Appear to be Slowly Normalizing