With most official data reports for the month of September still delayed and the October reports in danger of not being published,(1) financial markets and the Fed continue to fly with limited visibility regarding the current state of the U.S. economy.
Despite the fog caused by the absence of official economic data, there are few signs of a noticeable slowdown in the economy for now. Real economic growth appears to have remained strong in Q3 2025 ahead of the government shutdown, with the Bloomberg median economists’ forecast indicating that gross domestic product rose 2.8% on a quarter-over-quarter seasonally adjusted annualized rate (“SAAR”) basis, above the 1.6% SAAR seen in the first half of 2025. Consumption remains bifurcated with higher end consumers buoyed by wealth gains willing to spend, while consumers in the lower end of the income spectrum appear to be tightening their belt, a situation worsened by the shutdown and the ongoing weaker labor demand. Of note, unemployment insurance claims, which most states have continued to collect and report in October, do not suggest a meaningful deterioration in the labor market.
Given the statutory need to calculate the cost-of-living adjustment for next year’s Social Security benefits,(2) the Administration decided to publish the September Consumer Price Index (“CPI”) report based on data that was collected prior to the government shutdown. Consumer inflation was softer-than-expected with core CPI rising 0.23% month-over-month largely driven by a downside miss in shelter inflation, particularly owner’s equivalent rent. The muted monthly gain in shelter inflation was driven by the same medium-sized cities that drove last month’s upside surprise and suggests reduced underlying data quality and increased reliance on statistical imputation. Meanwhile, goods inflation excluding food and energy (“core goods”) continued to rise while core services excluding shelter inflation were relatively unchanged. The former reached 2.9% 3-month SAAR, its highest level since mid-2023, while the latter was 4.7% 3-month SAAR. Altogether, with the annual rate of consumer inflation stuck around 3% year-over-year (“yoy”) as tariffs and stricter immigration policy are still working their way into goods and services prices,(3) we expect inflation will remain sticky for some time.
“No official government data, no real problem” must have been the mantra of financial markets in October, as the optimism that has dominated much of the past few months continued, in turn driving equities higher, credit spreads tighter, and Treasury yields lower. Agency MBS further benefitted from strong fixed income fund flows and low interest rate volatility.
Monetary Policy
The Fed continued its “risk management” interest rate cuts, lowering the Federal Funds Target rate to 3.75 – 4.00% at the October FOMC meeting. However, Chair Powell reiterated his view that there is no risk-free path going forward while the FOMC appeared increasingly split. Of note, the decision saw the third consecutive meeting with at least one dissenting opinion, though this time one FOMC voting member dissented in favor of a larger cut while another member dissented in favor of holding interest rates steady. During the press conference, Chair Powell opted to buy some policy optionality, sounding relatively hawkish by signaling that a December rate cut is not a foregone conclusion. We view this signaling by the Chair as largely a way to accommodate a variety of views within the FOMC. Early speeches following the meeting suggest that several officials would prefer to wait for additional information on the labor market and the inflation outlook before delivering additional rate cuts.
Fixed Income Markets and Volatility
Treasury yields were little changed in October on net, as limited data and a generally muted trading environment saw long-term yields decline gradually while short-term yields were mostly flat. The Treasury yield curve, as measured by the difference between 2- and 10-year yields, flattened to the lowest level since late July, which was immediately before the July non-farm payrolls report placed increased emphasis on the Fed’s need to cut interest rates given a weakening labor market. The decline in nominal Treasury yields coincided with lower inflation breakevens. Oil prices, often correlated with Treasury inflation compensation, declined over the course of the month, despite the U.S. announcing new sanctions against Russian oil and gas majors. Government bond markets in developed economies also saw reduced pressure on yields. Interest rate volatility declined once again during the month, largely led by small, realized rate moves during the month.
Swap spreads experienced additional widening in October, with 10-year swap rates remaining unchanged, thereby increasing the difference between swap and Treasury yields by seven basis points. The widening moved in line with a decline in term premia seen during the month. In addition, markets continue to anticipate upcoming regulatory reforms, which are assumed to lower balance sheet costs as bank capital standards are now expected to increase only marginally from current levels, well below levels set when the Basel Endgame was proposed in July 2023. Of note, despite the widening in longer-term maturity swap spreads, short-term swap spreads – for example on 2-year maturities – saw more limited widening, given their greater correlation to funding market conditions.
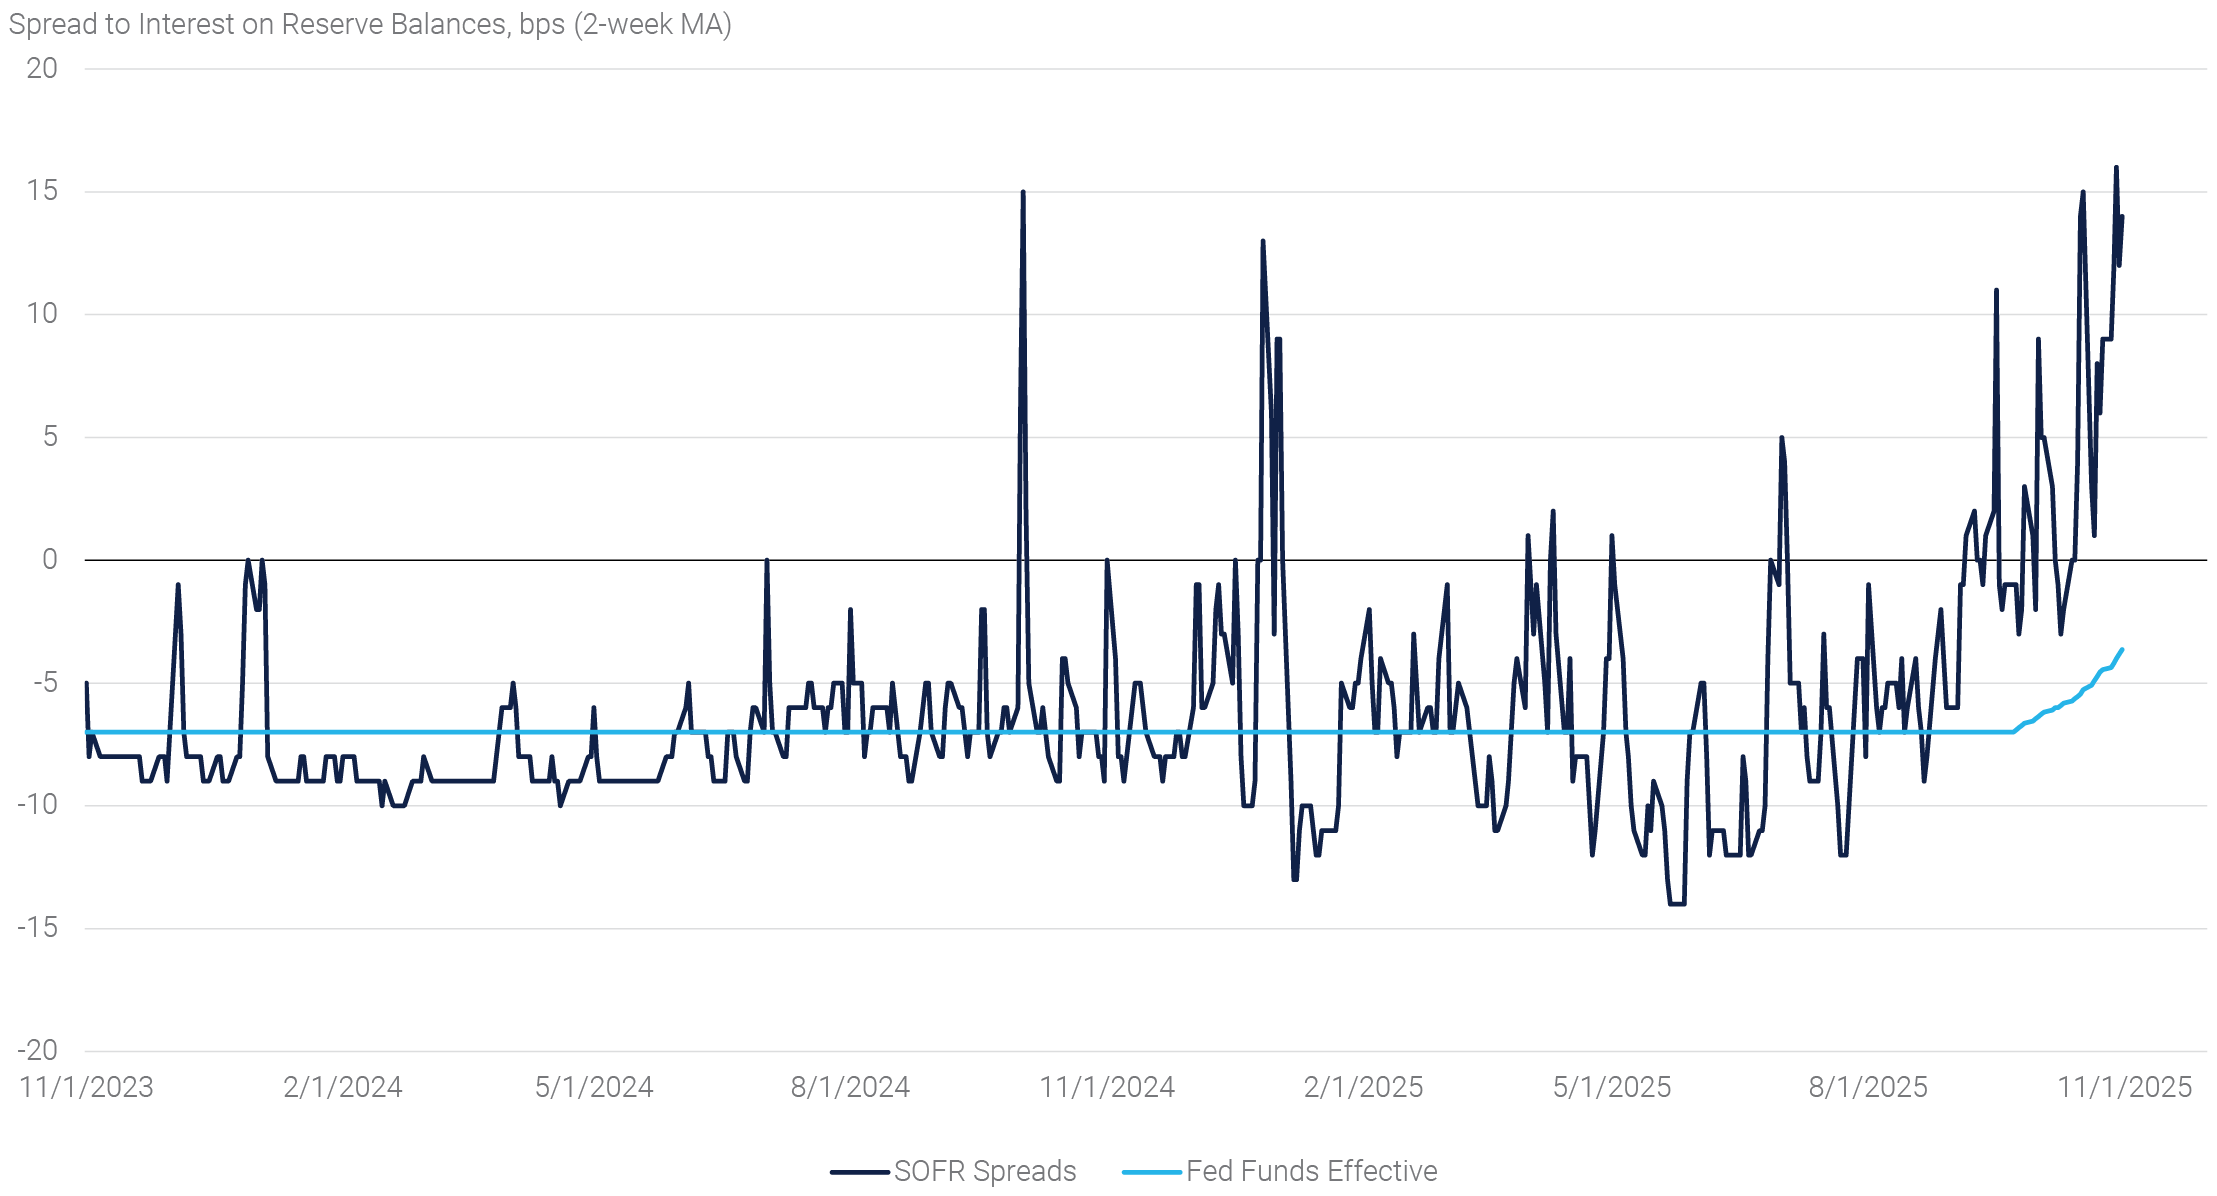
Short-term interest rate markets continued to see increased pressure in October, with the Secured Overnight Funding Rate and other short-term benchmark interest rates rising relative to the Fed Funds Target Range throughout the month (see panel 1). The increased pressure appears to be driven by bank reserves falling below $3 trillion in late September – a level long believed to be a potential water mark between “abundant” and merely “ample” reserves.(4) The Fed’s decision to end its balance sheet runoff, discussed in more detail below, is in direct response to the higher front-end funding rates. In addition, the Treasury Department issued $196 billion of Treasury bills net of maturities in October, adding to the pressure to short-term rates.(5) While higher funding rates increase financing costs, markets have continued to trade orderly. The Fed’s Standing Repo Facility – a recent addition to the toolkit that could help provide a ceiling in rates – has seen more frequent usage in recent days, though at an average of $10.6 billion across 10 days in October, usage remains limited, signaling opportunistic uptake rather than broad-based pressure.
Panel 1:
Short-Term Interest Rates Have Been Pressured Higher
Risk Assets and Agency MBS Spreads
Risk assets performed well in October, with the S&P 500 rising for a sixth consecutive month, generating a total return of 2.3% in the month. The healthy returns were driven by continued optimism around ever-growing AI investments and generally robust corporate earnings reports. S&P earnings per share are tracking 12% yoy growth in Q3 2025, ahead of expectations at the beginning of the earnings season. Meanwhile, corporate credit underperformed, with the Bloomberg U.S. Aggregate Corporate Bond Index generating a -0.28% excess return. High-yield bonds followed a similar trend, highlighting growing media attention on potential pressures in the corporate credit space.
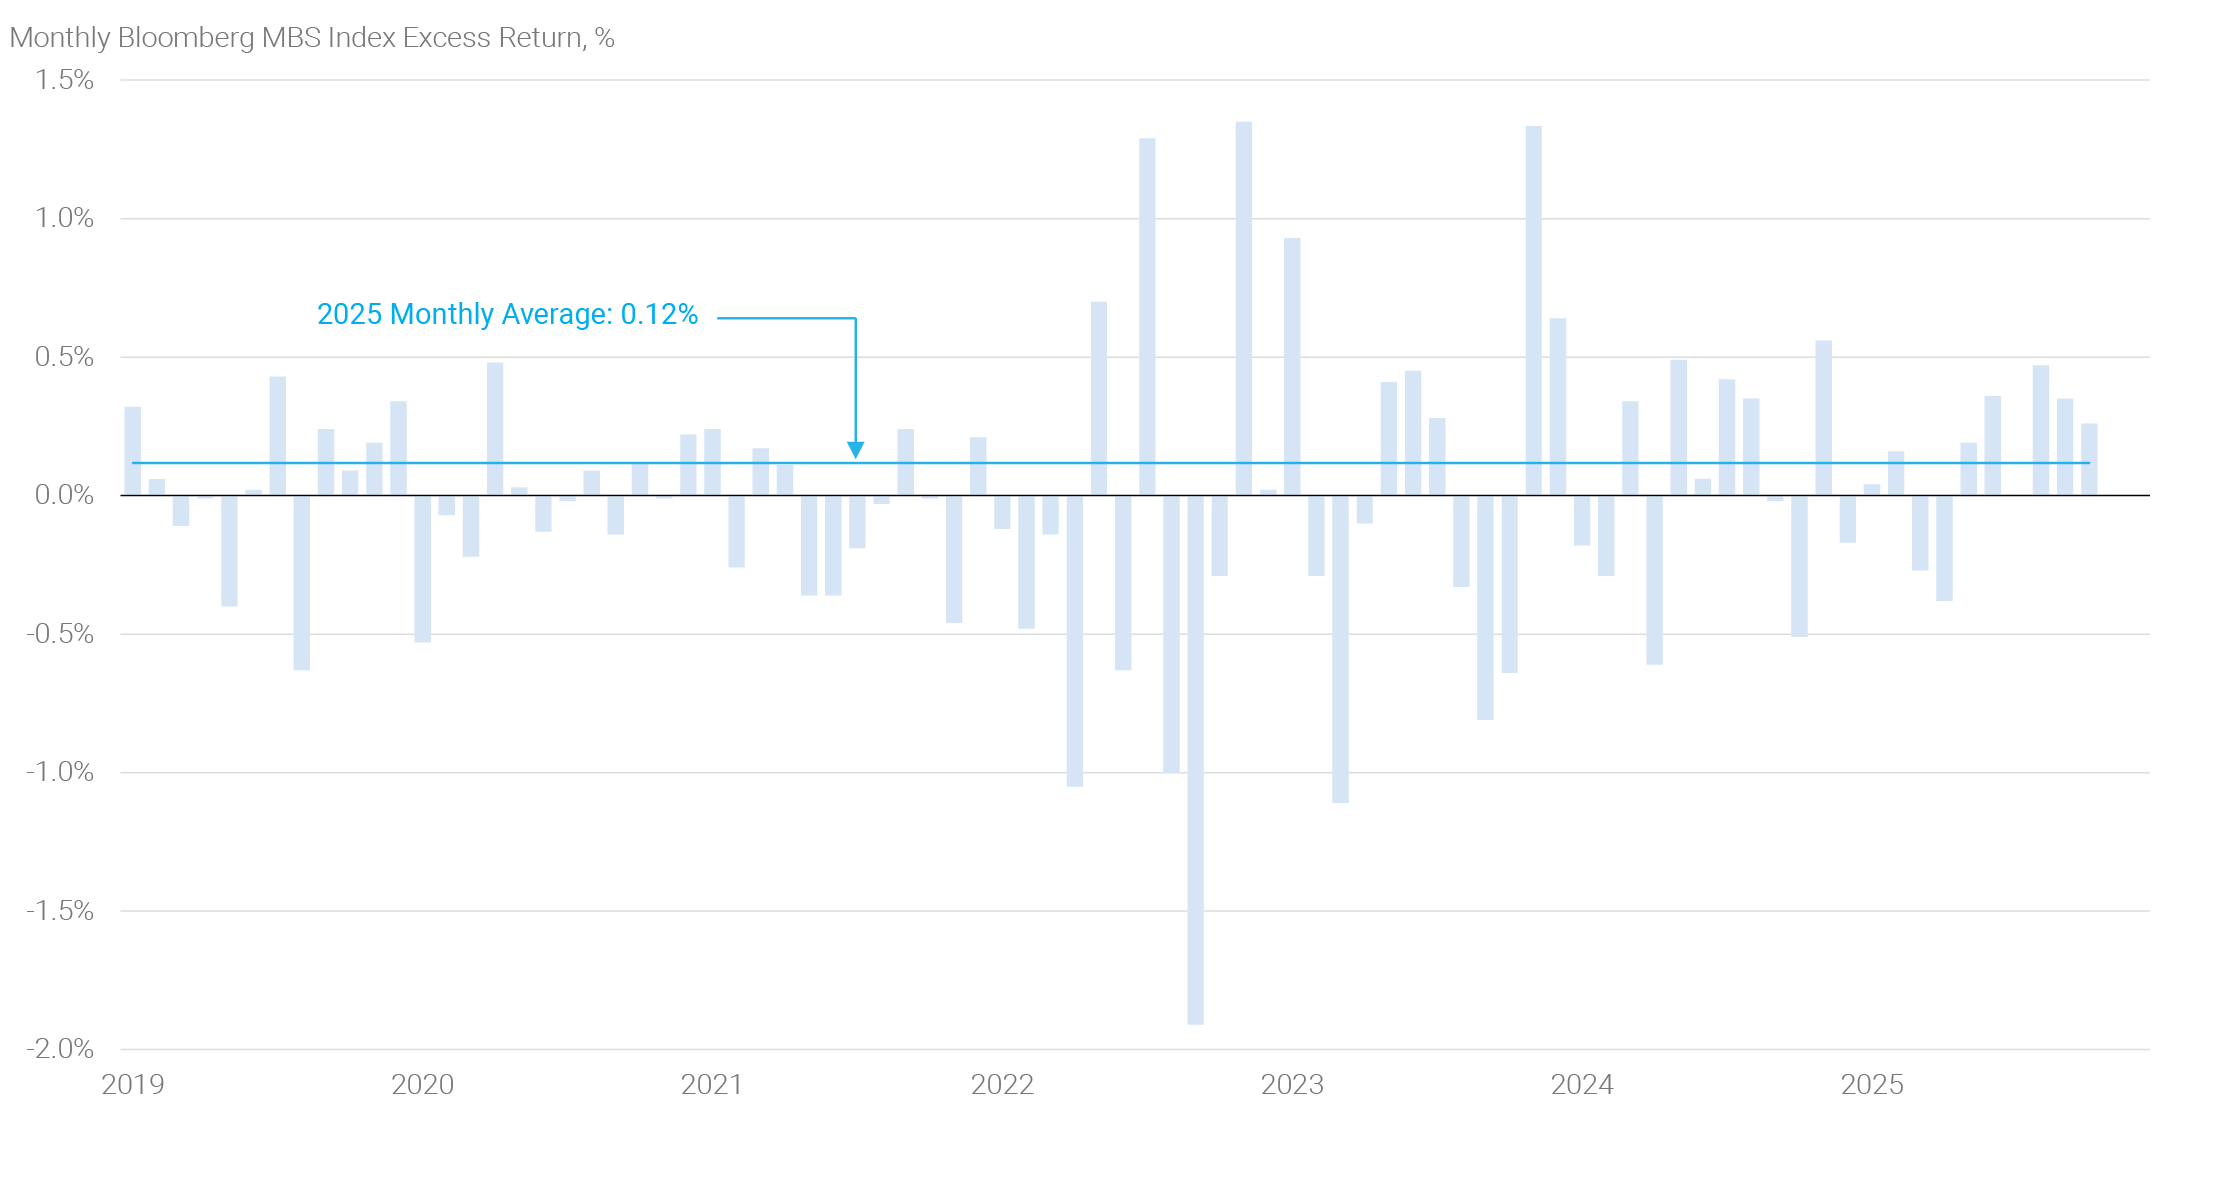
Agency MBS continued its solid run of spread tightening in light of a positive outlook for the sector, with the Bloomberg U.S. MBS Index delivering a positive excess return in five out of the last six months(6) (see panel 2). Strong demand from money manager inflows, mortgage REIT equity raises, and collateralized mortgage obligation creation have provided tailwinds. Additionally, reduced interest rate volatility continues to benefit the sector by lowering hedging costs. Lower coupon MBS have outperformed, largely because a meaningful share of funds flows has been invested to match the coupon distribution of the index and broader market – both of which remain meaningfully skewed toward lower coupon MBS issued in size during the 2020/2021 housing market boom.
Panel 2:
Recent MBS Excess Returns Have Been Strong
The End of QT and the Next Phase of the Fed's Balance Sheet Strategy
At its October 29 meeting, the
FOMC announced a pivotal shift in balance sheet policy, confirming that it will conclude its balance sheet runoff, commonly referred to as Quantitative Tightening (“QT”), on December 1. The decision ends a multi-year effort to unwind the extraordinary asset purchases undertaken during the pandemic and earlier crises. It also marks the start of a new phase in the Fed’s approach to reserve management and market operations.
Panel 3:
The Fed Has Unwound Significantly More Assets in This QT Cycle
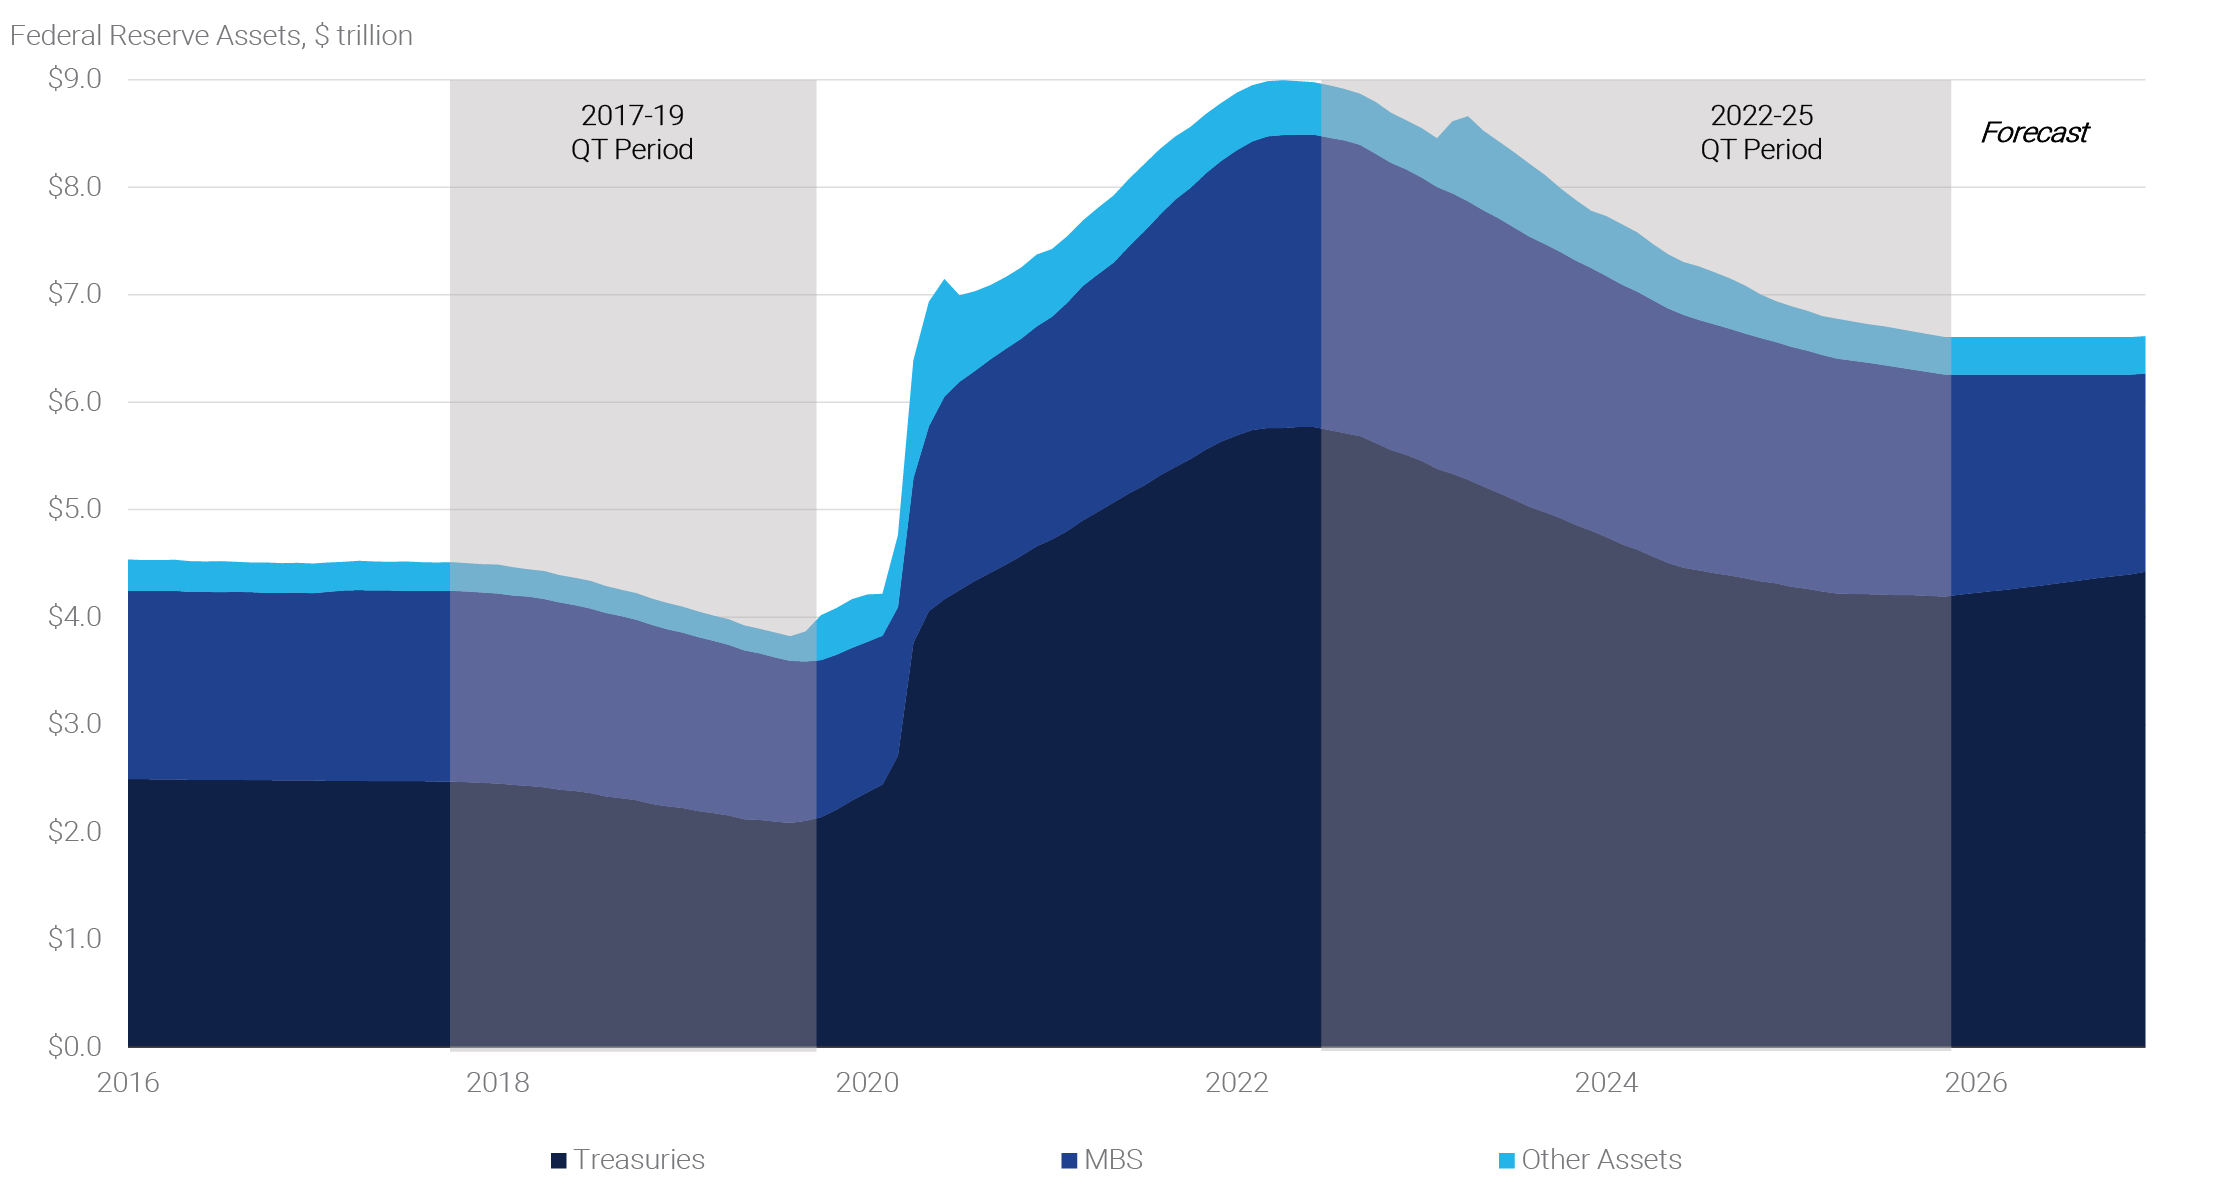
Since QT began in 2022, the Fed’s balance sheet has declined by roughly $2.4 trillion, from a peak of $9.0 trillion to about $6.6 trillion today. For comparison, the Fed managed to reduce holdings by only $640 billion during the prior QT episode in 2017–2019 (see panel 3). Within the System Open Market Account (“SOMA”) portfolio, Treasury securities have declined by about $1.6 trillion and Agency MBS by roughly $700 billion. The Fed still holds $4.2 trillion in Treasuries and $2.1 trillion in MBS, leaving the portfolio composition largely unchanged from the start of QT, with MBS continuing to represent about one-third of total holdings.
The decision to end QT reflects both operational caution and emerging signals suggesting that reserves may be nearing the lower end of the “ample” range. Recent pressure in repo markets and a series of upward moves in the effective federal funds rate, which has repriced higher within the target range three times since September, imply that liquidity is tightening more than the Fed would like. Officials likely remain wary of a repeat of the 2019 money-market dislocations that forced emergency repo operations and undermined the Fed’s operational credibility. By halting QT now, policymakers aim to ensure a smooth transition to a stable level of reserves, avoiding unintended liquidity shortfalls that could disrupt funding markets or impair monetary policy transmission.
In this next phase, the Fed will shift to maintaining a steady-state balance sheet. Beginning in December, it will fully reinvest all maturing Treasury securities, ending the $5 billion monthly cap on passive redemptions. These reinvestments will occur through non-competitive bids at Treasury auctions aligned with regular offering sizes. Meanwhile, as MBS principal payments – currently around $15 billion per month – continue to roll off, the Fed will reinvest those proceeds into Treasury bills purchased in the secondary market. This approach supports the Fed’s longstanding goal of returning to a Treasury-dominant portfolio and gradually tilting toward shorter maturities.
Panel 4:
The SOMA Portfolio Is Skewed Towards Longer Maturities
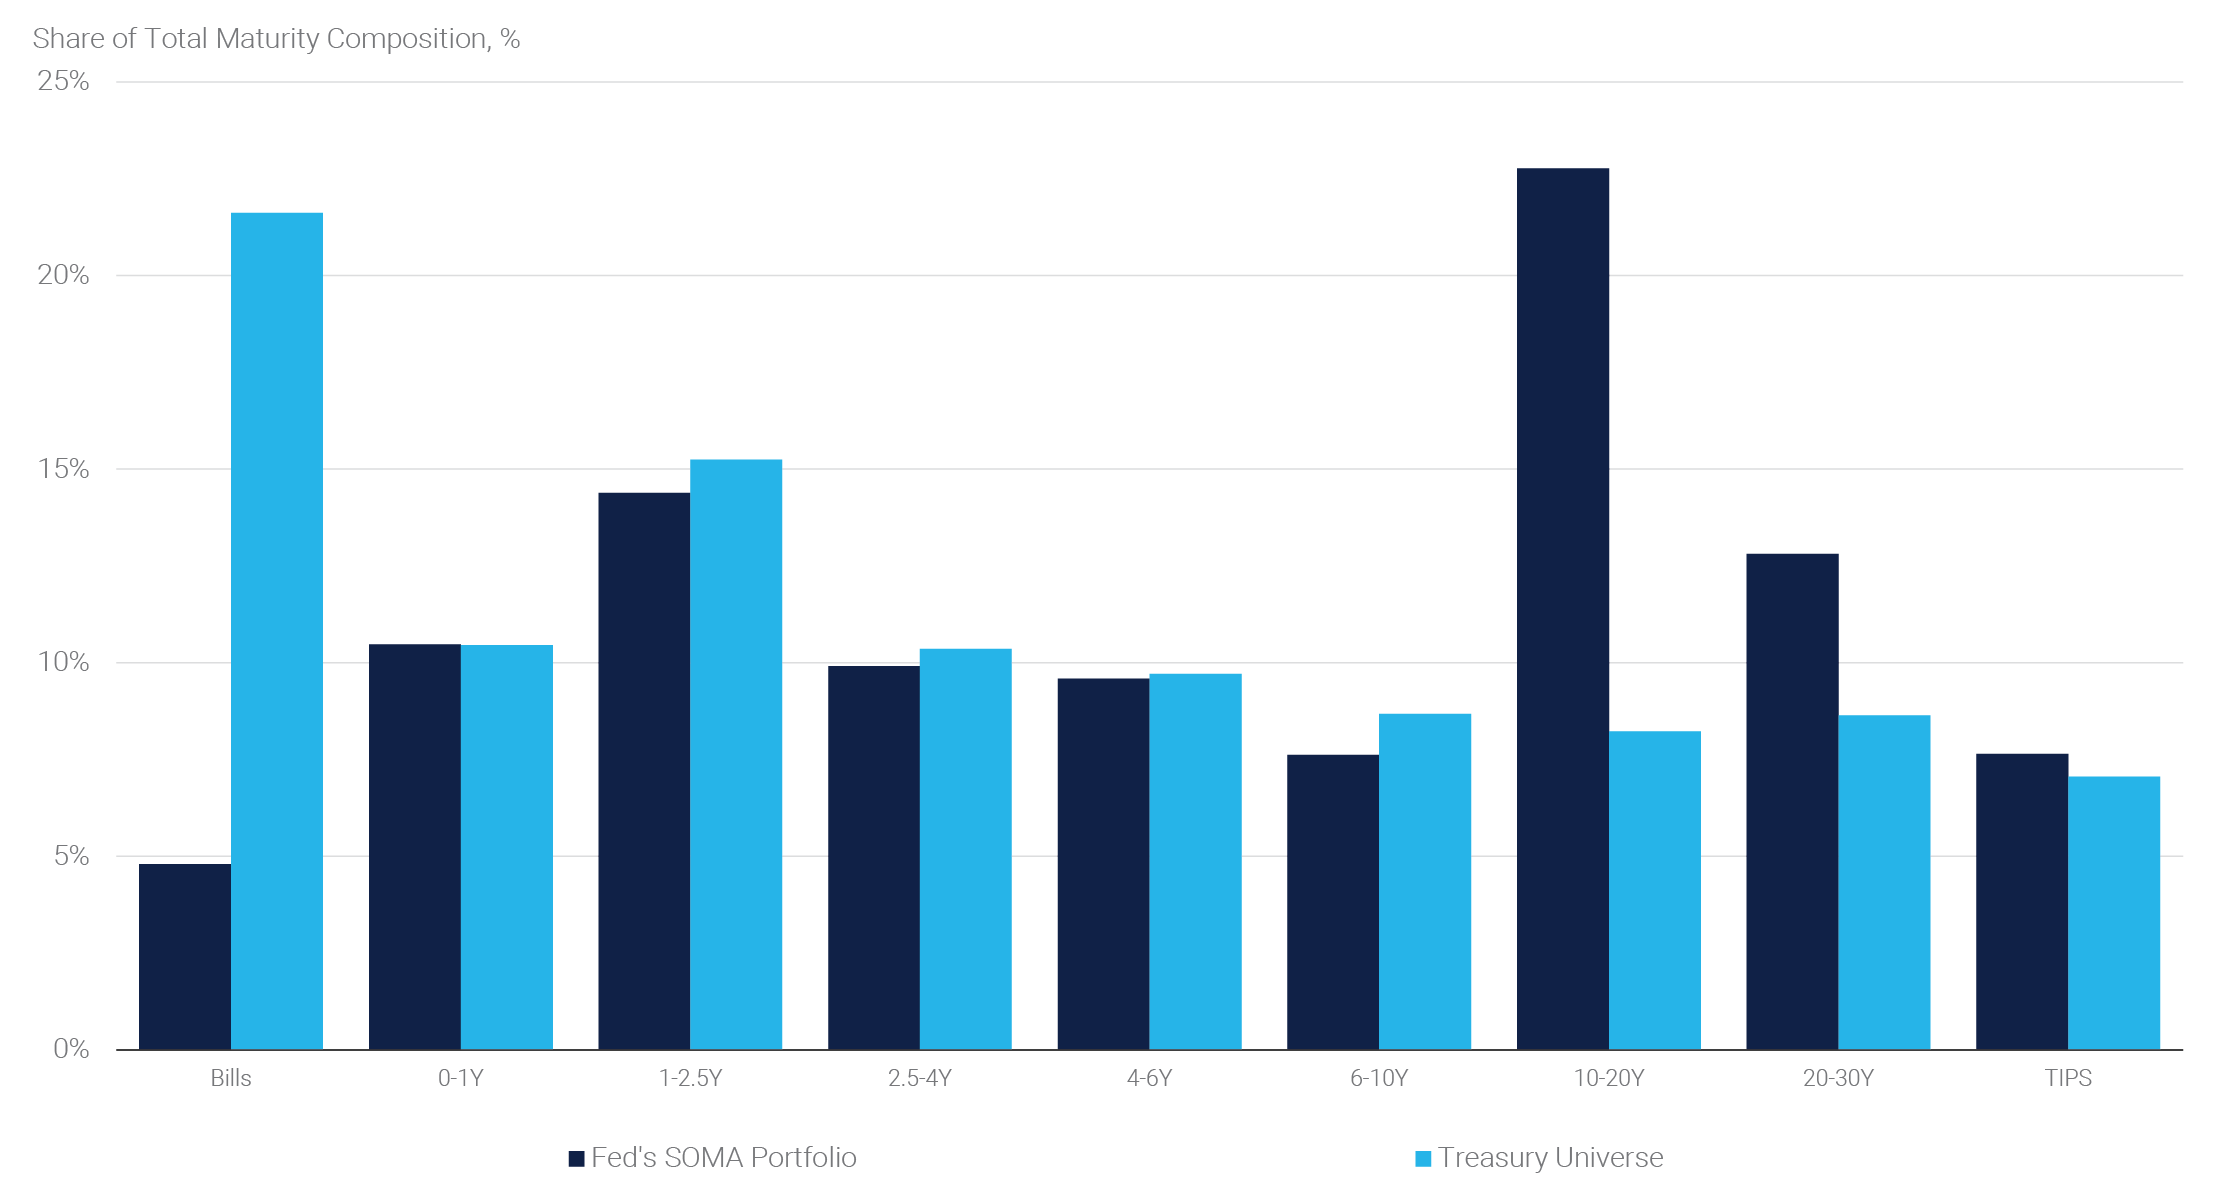
The Fed’s current SOMA portfolio remains heavily skewed toward longer maturities (see panel 4), a legacy of multiple rounds of quantitative easing. By directing new reinvestments into Treasury bills, the Fed can maintain the overall size of its balance sheet while gradually realigning its maturity profile to better reflect the broader Treasury market. This shift not only supports a more neutral portfolio composition but also enhances the Fed’s operational flexibility. Emphasizing shorter-term securities like Treasury bills preserves the Fed’s ability to adjust the balance sheet in the future without placing undue pressure on longer-term yields.
The immediate market effects of this shift are likely to be more incremental in nature. The $5 billion monthly reinvestment is small relative to overall issuance and does not materially change the supply of Treasuries available to the private sector. However, it modestly reduces the Treasury’s near-term borrowing needs. More notable is the roughly $15 billion per month in secondary-market purchases of Treasury bills tied to MBS reinvestments. While small relative to the size of the bill market, the bill purchases create a reliable source of demand, particularly as the Treasury continues to rely heavily on bill issuance to finance deficits. Taken together, the Fed's reinvestment strategy should support marginally lower yields and ease short-term funding pressures.
For the MBS market, the implications are somewhat mixed. While fully anticipated by financial markets in advance, the decision to reinvest MBS paydowns into Treasuries rather than new MBS represents an incremental mortgage basis widener, as it reduces a potential consistent source of official demand. However, broader fixed income conditions should benefit from the end of QT. A reduced net supply of duration assets, improved liquidity in funding markets, and a potential return of domestic banks as MBS buyers – as excess reserves could be redeployed into higher yielding securities – may support valuations over time.
Looking further ahead, at the press conference following the October FOMC meeting, Chair Powell emphasized that the Fed expects to hold the balance sheet steady “for a time, but not a tremendously long time.” Once reserve balances begin to fall again due to organic growth in the Fed’s liabilities, such as currency in circulation and the Treasury’s General Account, the Fed will need to resume asset purchases to maintain ample reserves. This next phase, anticipated to begin around mid-2026, will consist of Reserve Management Purchases aimed at offsetting natural increases in liabilities and maintaining stable reserves. These operations are expected to, once again, focus heavily on Treasury bills, reinforcing the Fed’s preference for shorter-duration assets and greater flexibility in balance sheet management.
The decision to end QT marks a major milestone in the post-pandemic normalization process. While the immediate market reaction has been contained, the policy shift reflects a broader recalibration of the Fed’s operating framework. We are encouraged that policymakers appear intent on balancing the goal of restoring a leaner balance sheet with the need to ensure ample liquidity and maintain market stability.