Welcome to the inaugural post of our periodic thought piece, Macro & Market Musings, where we will discuss our take on the most salient economic, market, and mortgage developments.
Key Findings
- The U.S. economy remains strong, with real GDP recording 2.8% annualized growth in the third quarter. The labor market is cooling, best observed in a hiring slowdown though employers are refraining from laying off workers for now. Inflation continues to trend lower, but services inflation remains relatively firm in housing, medical care, and transportation.
- Treasury yield levels rose meaningfully as a combination of stronger economic data, a more uncertain outlook for monetary policy, and implications from the U.S. election weighed on fixed income markets.
- Despite some optimism following the September 50 basis point interest rate cut, the U.S. housing market remains anchored at relatively low transaction volumes. Inventory levels have risen in parts of the country, bringing some softening in prices, though aggregate affordability continues to be poor.
The U.S. Economy
Economic Growth
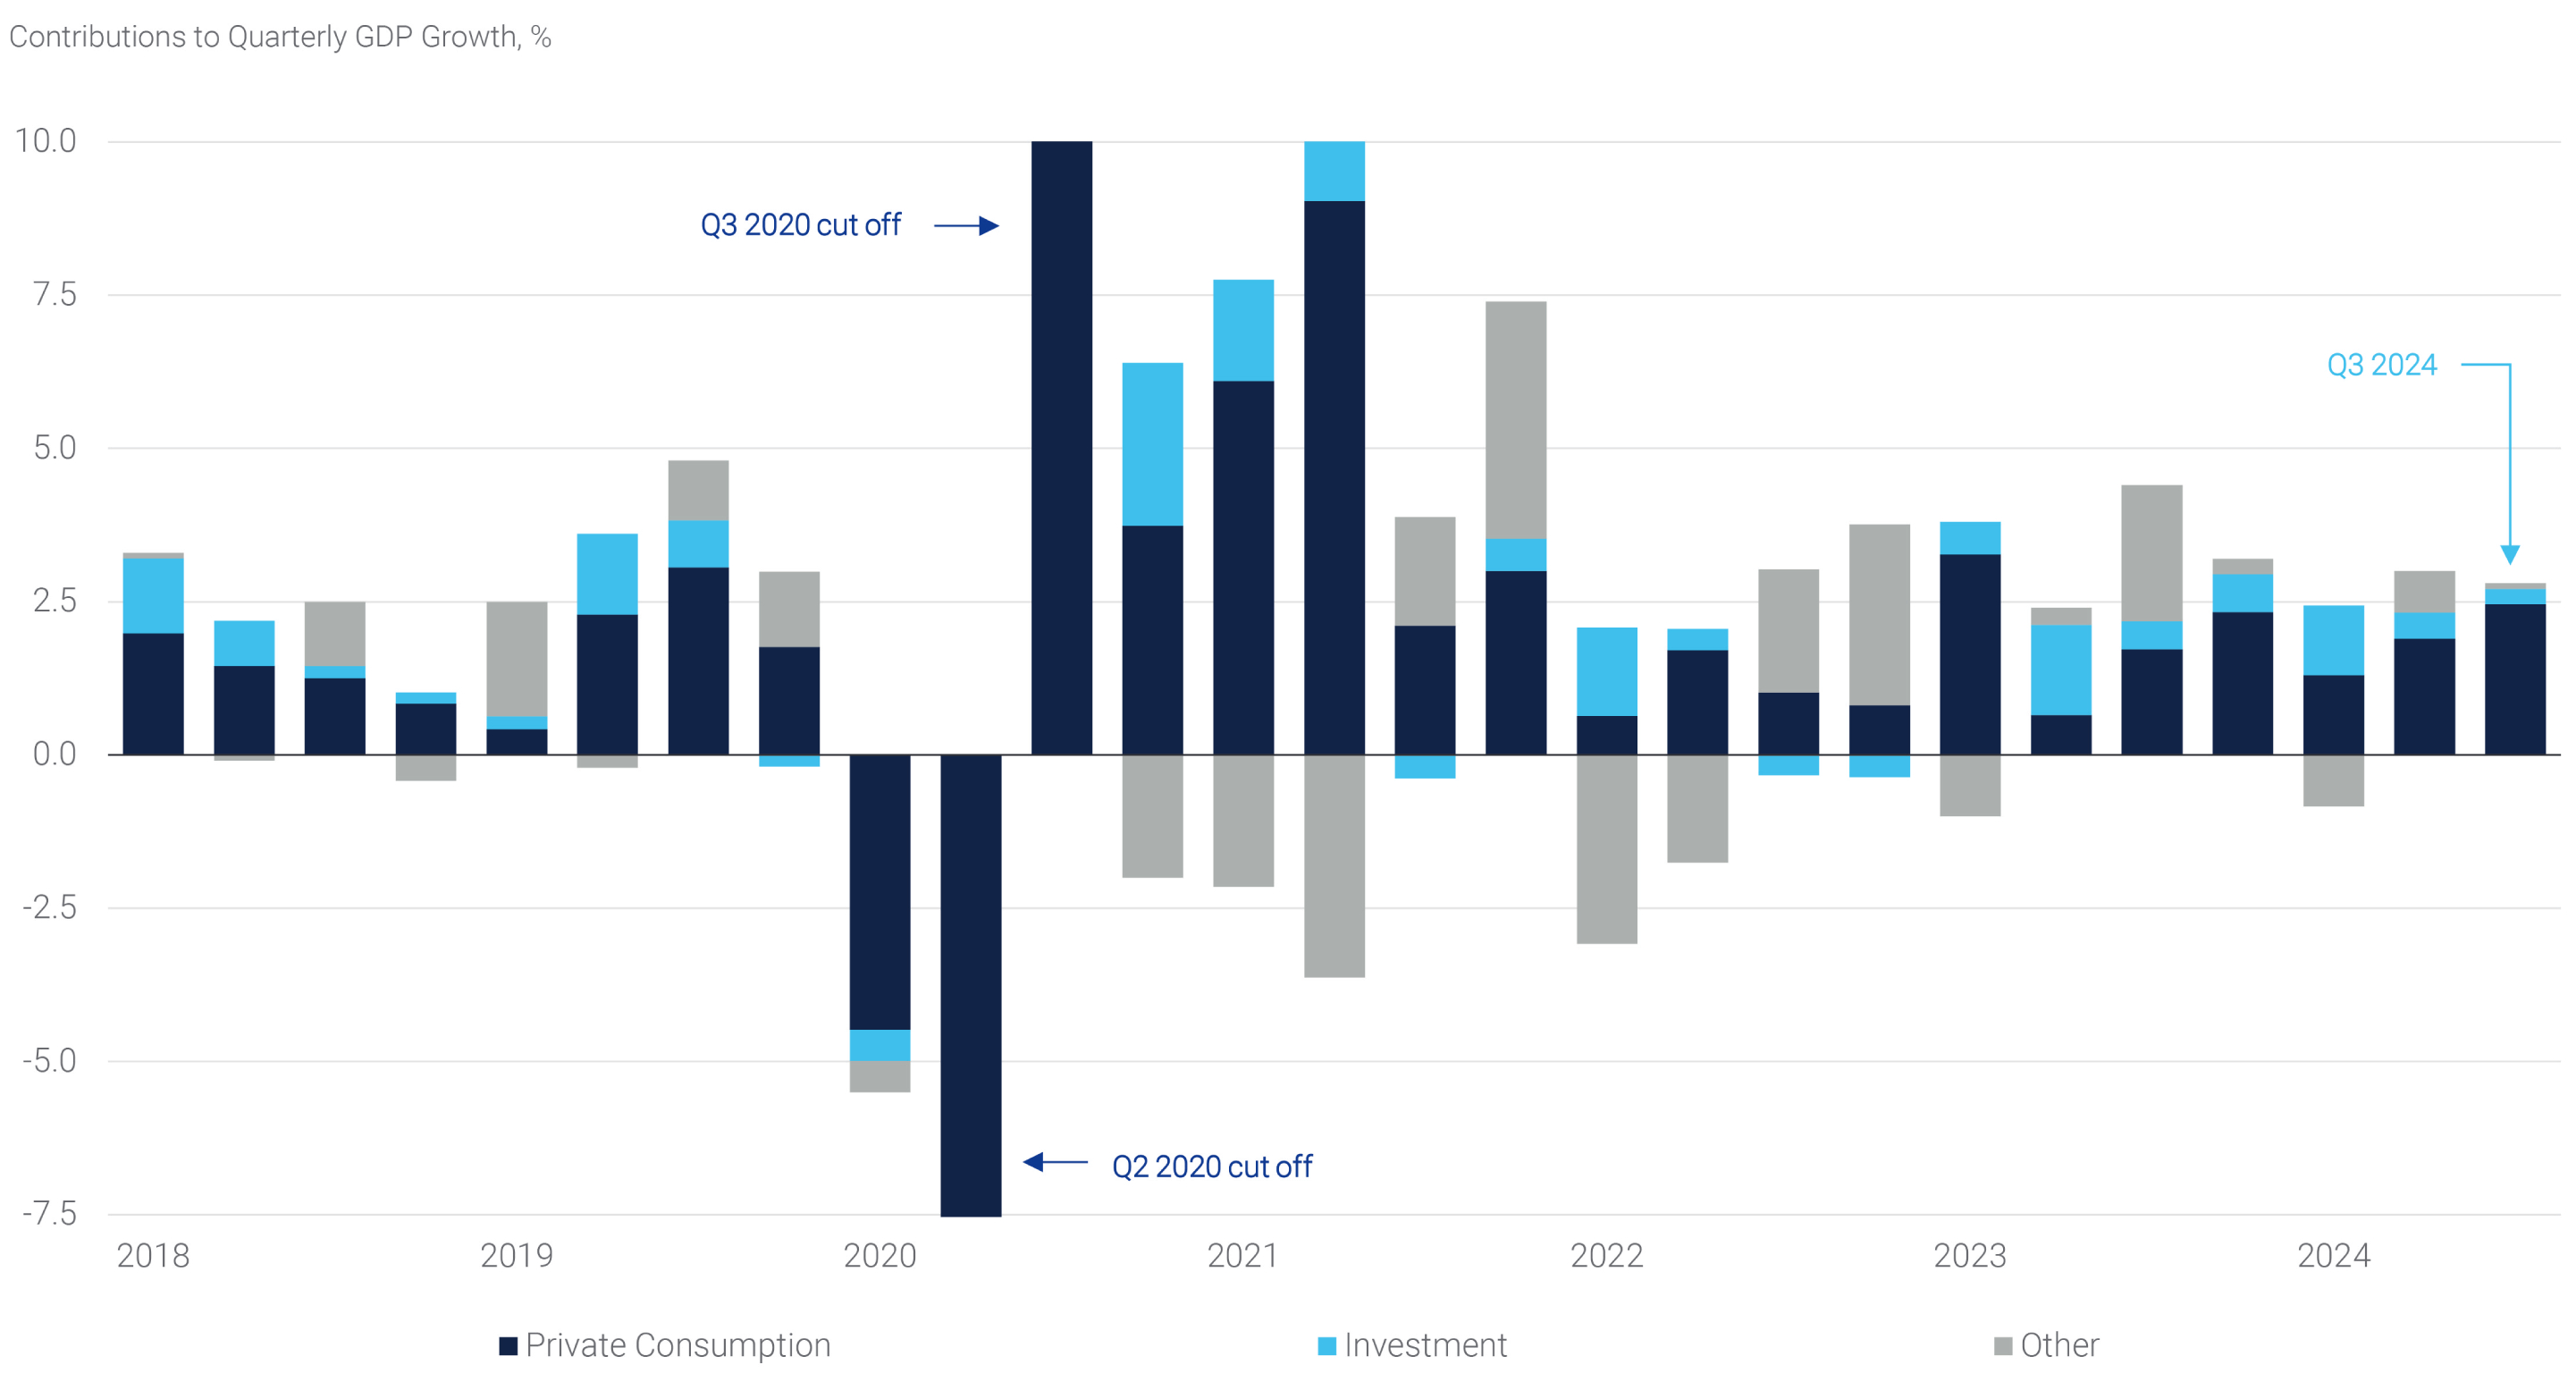
The economic data released in October has done little to change the narrative of a resilient U.S. economy that is expanding at an above average pace. According to the initial official estimate, gross domestic product (“GDP”) grew at a 2.8% seasonally adjusted annual rate (“SAAR”) in Q3. Headline growth was driven by robust consumption, which rose 3.7% SAAR, the fastest quarterly pace in over a year (see panel 1). Meanwhile, private fixed investment was mixed as equipment investment benefitted from aircrafts and the AI-related capital expenditure boom, while other sectors were weak. For example, residential investment fell by 5.1%, weighed down by a slump in the construction of new homes. Elsewhere in the GDP report, government spending rose at a solid 5.0% SAAR, in turn boosting quarterly GDP growth by nearly one percentage point. The fiscal largess was led by a 14.9% surge in defense spending, presumably driven by higher military spending related to support for Ukraine and Israel.
Panel 1:
Consumption Continues to Fuel the American Economy
Labor Market
A solid run of data eased concerns about rapid cooling in the labor market and raised doubts over the pace of further easing by the Federal Reserve (the “Fed”), despite conditions remaining weaker than at the start of the year. Even if the most recent non-farm payrolls (“NFP”) report showed an anemic gain, there is broad consensus that the October figure is plagued by noise and provides limited signal on the actual state of the labor market given the impact from labor strikes and hurricanes. Therefore, the true health of the jobs market lies somewhere in between the robust 223 thousand September revised number and the latest 12 thousand estimate. Nonetheless, the Fed will likely take solace in the unemployment rate holding steady at 4.1%.
Inflation
On the inflation front, the Fed’s preferred personal consumption expenditure (“PCE”) index was slightly ahead of market expectations. The core index measure, which excludes food and energy consumption, rose 2.7% year-over-year (“yoy”) in September. Service sector inflation continues to drive pricing pressures, as shelter inflation is slow to normalize, but medical and transportation sector pricing pressures picked up. However, the Employment Cost Index for Q3 2024 showed that wages and benefit increases are normalizing, coming in at 3.9% yoy compared to 4.3% yoy a year ago. The wage moderation is driven by the private sector, as government wages have been slower to adjust.
Altogether, with a somewhat stable unemployment rate and inflation picture, the implications for monetary policy seem evident as the Fed is broadly expected to cut rates 25 basis points (“bps”) at their November meeting given the better balance of risks.
Financial Markets
Interest Rates and Volatility
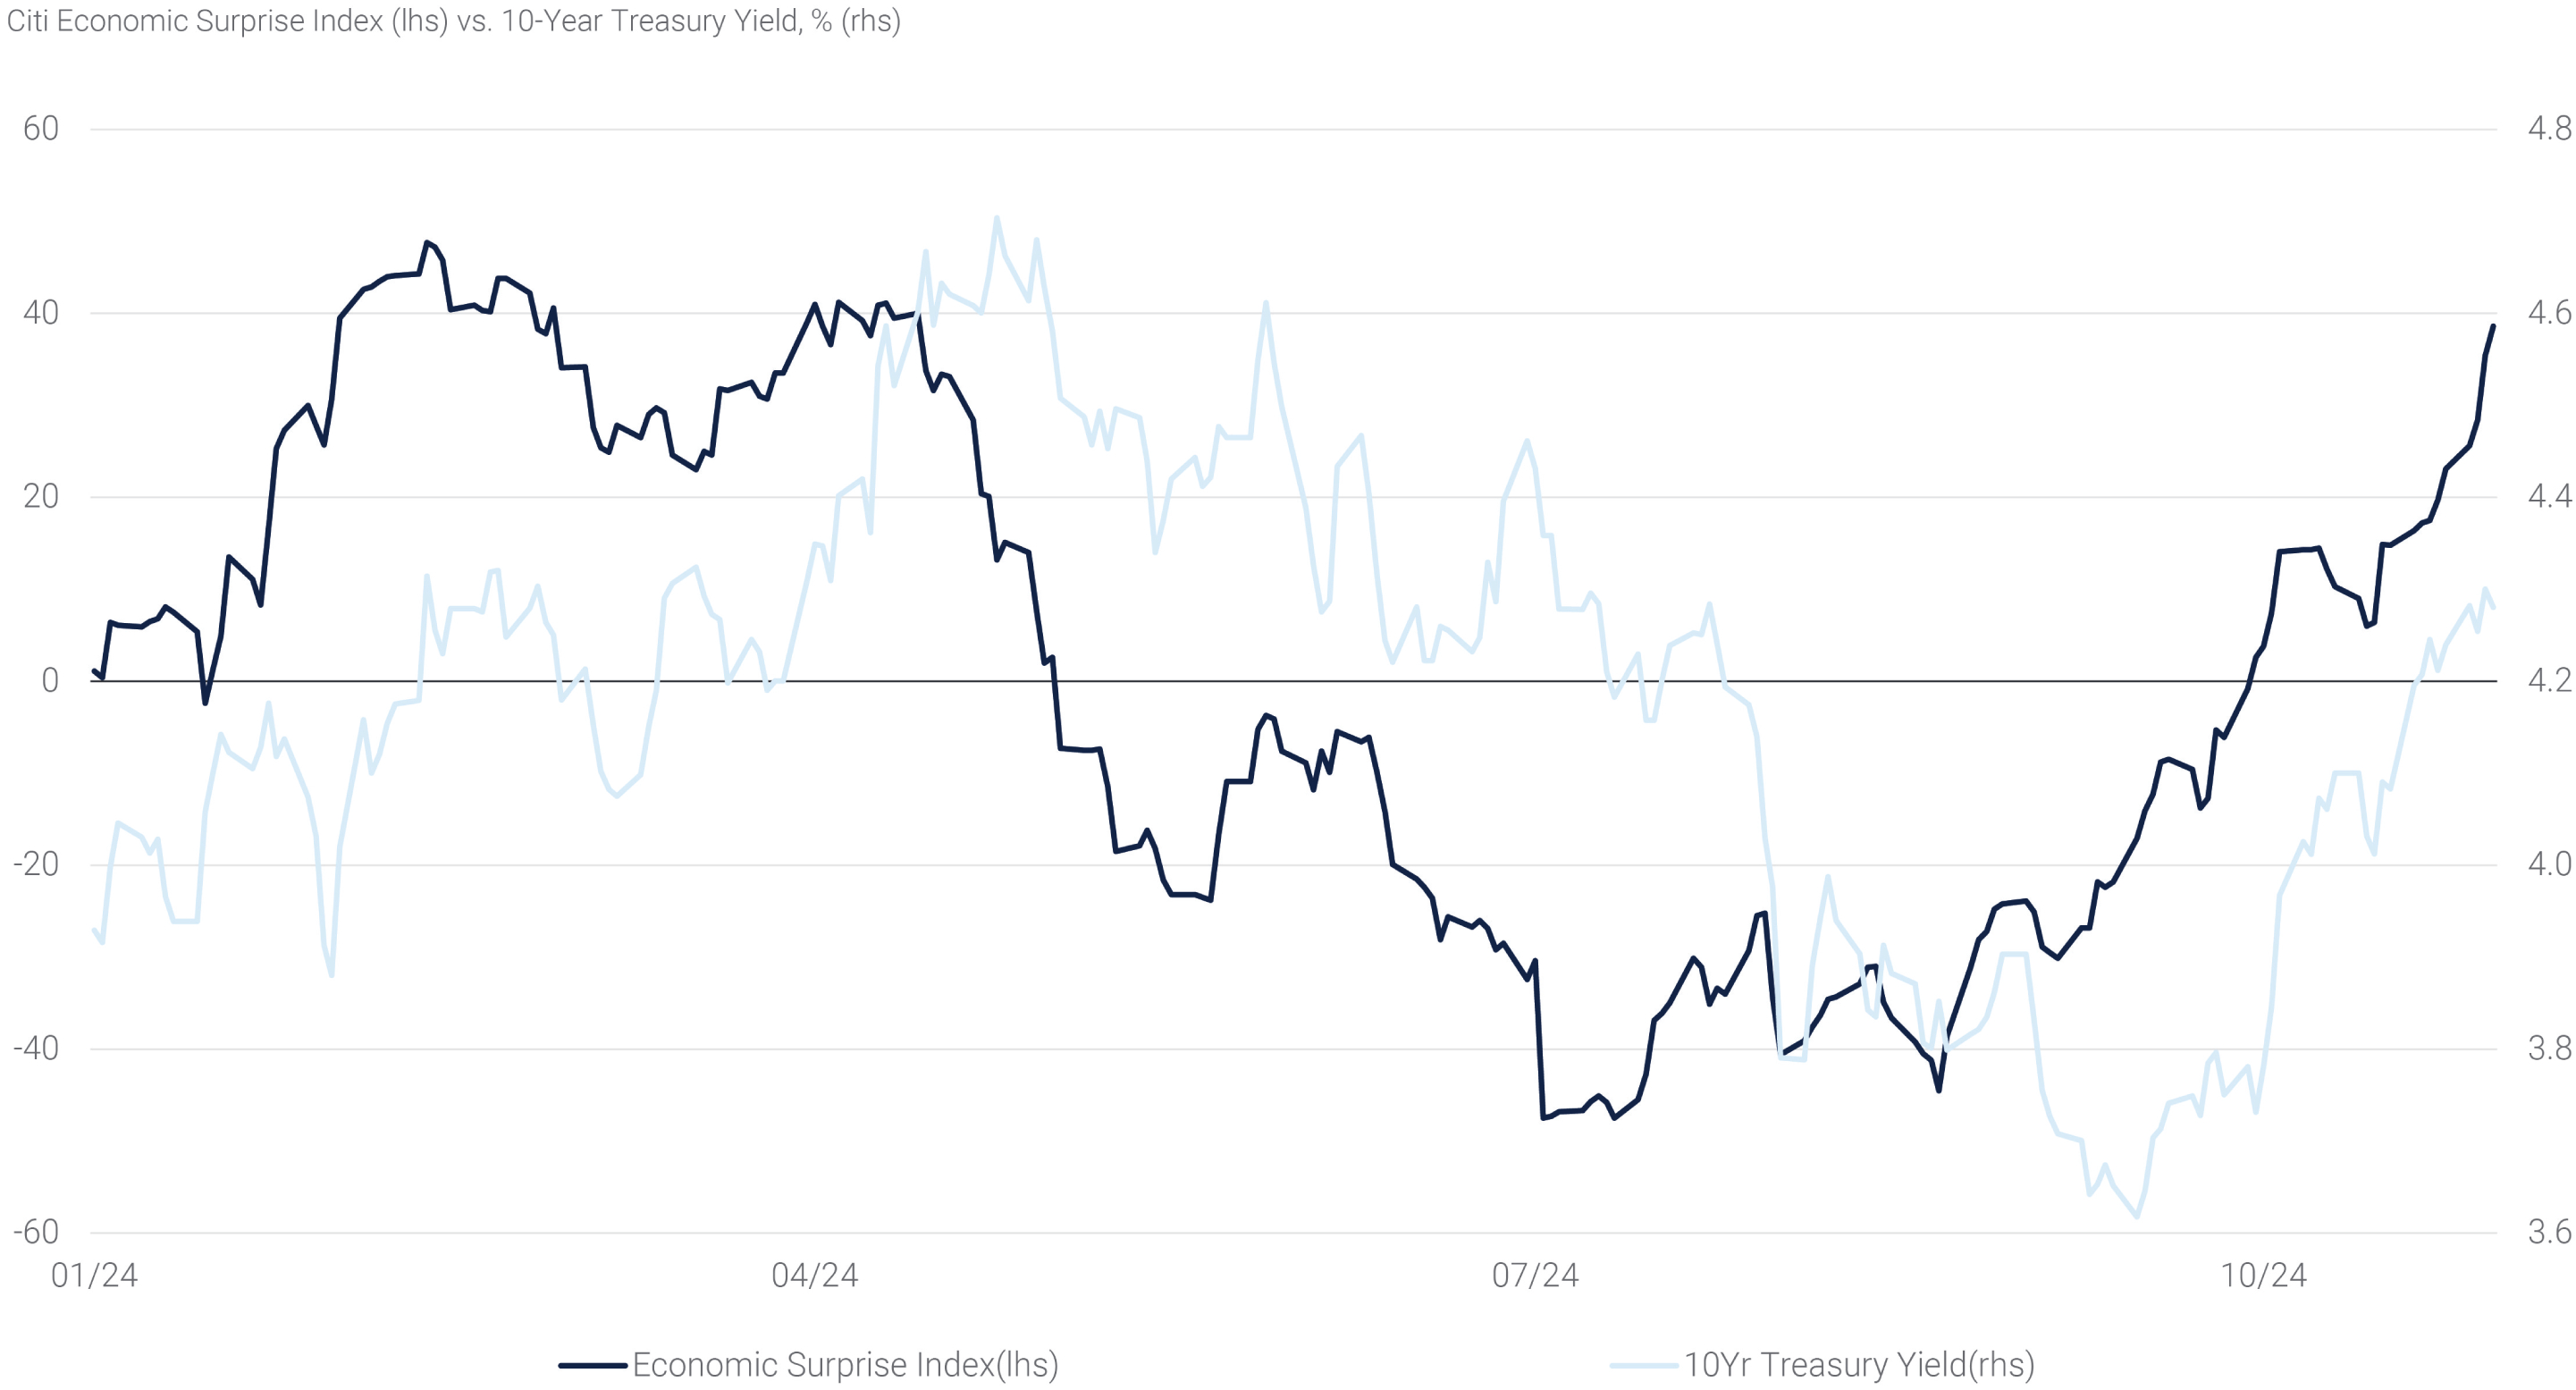
U.S. interest rates moved higher in October as macroeconomic data consistently exceeded expectations (see panel 2).(1) The resilient economy drove the market to scale back the probability of an aggressive rate-cutting cycle by the Fed as further policy easing appears less necessary. Using overnight index swap yields as an indicator, markets now price only 105 bps of easing over the next year, compared to 175 bps at the end of September. Many Fed policymakers have argued that the neutral rate, the theoretical rate at which policy is neither accommodative nor restrictive, is also higher than previously anticipated, which has been reflected in higher real yields across the Treasury curve.
In addition to monetary policy, yields have been affected by rising political uncertainties and concerns for an even faster expansion in the federal deficit. The MOVE index, a measure of expected bond market volatility over the coming month, rose as the November election date entered the index. As of the end of October, the market was increasingly pricing in the likelihood of a Republican sweep, which could result in higher fiscal spending and more debt. The heightened market volatility and anticipation of higher Treasury supply has driven 10-year term premium,(2) or the extra yield that market participants require to hold longer term Treasuries, to rise 40 bps in the past month to the highest level since October 2023.
Panel 2:
The Economy’s Resilience Keeps Surprising Most Observers
The growing Treasury supply has led to other market frictions as well. First, it has impacted funding markets – repo rates spiked into September quarter-end as intermediation constraints made it difficult for collateral and cash to efficiently make their way through the system. The SOFR benchmark rate reached 5.05% on October 1st, 22 bps higher than the Fed Funds Effective Rate at that time but normalized to rates consistent with other short-term interest rates within a few days after quarter-end. In addition, there has been a narrowing of swap spreads as higher funding for Treasury securities means investors demand a higher yield compared to the same maturity swaps. Long-dated swap spreads have historically correlated with deficits pre-2008 and the recent tightening is reflecting a similar trend. 10-year SOFR swap spreads have reached the tightest spreads on record at more than -50 bps.
Agency MBS & Credit
U.S. credit markets performed relatively well in October despite the Treasury market sell-off and continued corporate supply. Investment grade corporate bonds delivered an excess return of 38 bps(3) on the month notwithstanding supply volumes exceeding expectations once again at just under $100 billion, almost double the volume of new issuance compared to the same period last year.
On the other hand, agency mortgage-backed securities (“MBS”) generally underperformed in October, delivering -51 bps(4) in excess return. The performance of MBS in the middle of the coupon stack lagged while both low and high coupons fared better. An increase in mortgage refinancing drove a rise in MBS supply during the month, while bank and overseas demand for mortgages was tepid given the higher interest rate volatility and rise in yields. Going forward, bond fund inflows and increased demand for fixed income should prove to be a tailwind for MBS once volatility subsides at least somewhat.
Equities & Currencies
Equity markets notched new all-time highs in October as enthusiasm around the economy and relatively strong initial earnings results more than offset potential headwinds from rising rates. With roughly two-thirds of S&P 500 companies reporting quarterly results through the end of October, operating margins are estimated to have expanded 12% relative to the prior year, which represents continued strong margin growth. Ultimately, equity indices closed the month slightly lower, however, as large-cap tech companies disappointed lofty expectations for continued strong sales growth and profit margins. Outside of earnings, equities also grappled with the implications of the increased likelihood of a Republican sweep with enthusiasm around lower taxes and pro-business policy balanced by concerns around higher tariffs and renewed inflation.
Given this backdrop, the U.S. dollar strengthened against most major currencies, with the U.S. Dollar Index rising 3.2% in October. In the energy and commodities space, West Texas Intermediate crude oil rose 1.6% as production hikes and slowing demand remained in focus. Gold has logged yet another month of record high levels as it continued to be an appealing hedge against inflationary pressures.
Housing Affordability Remains Challenged
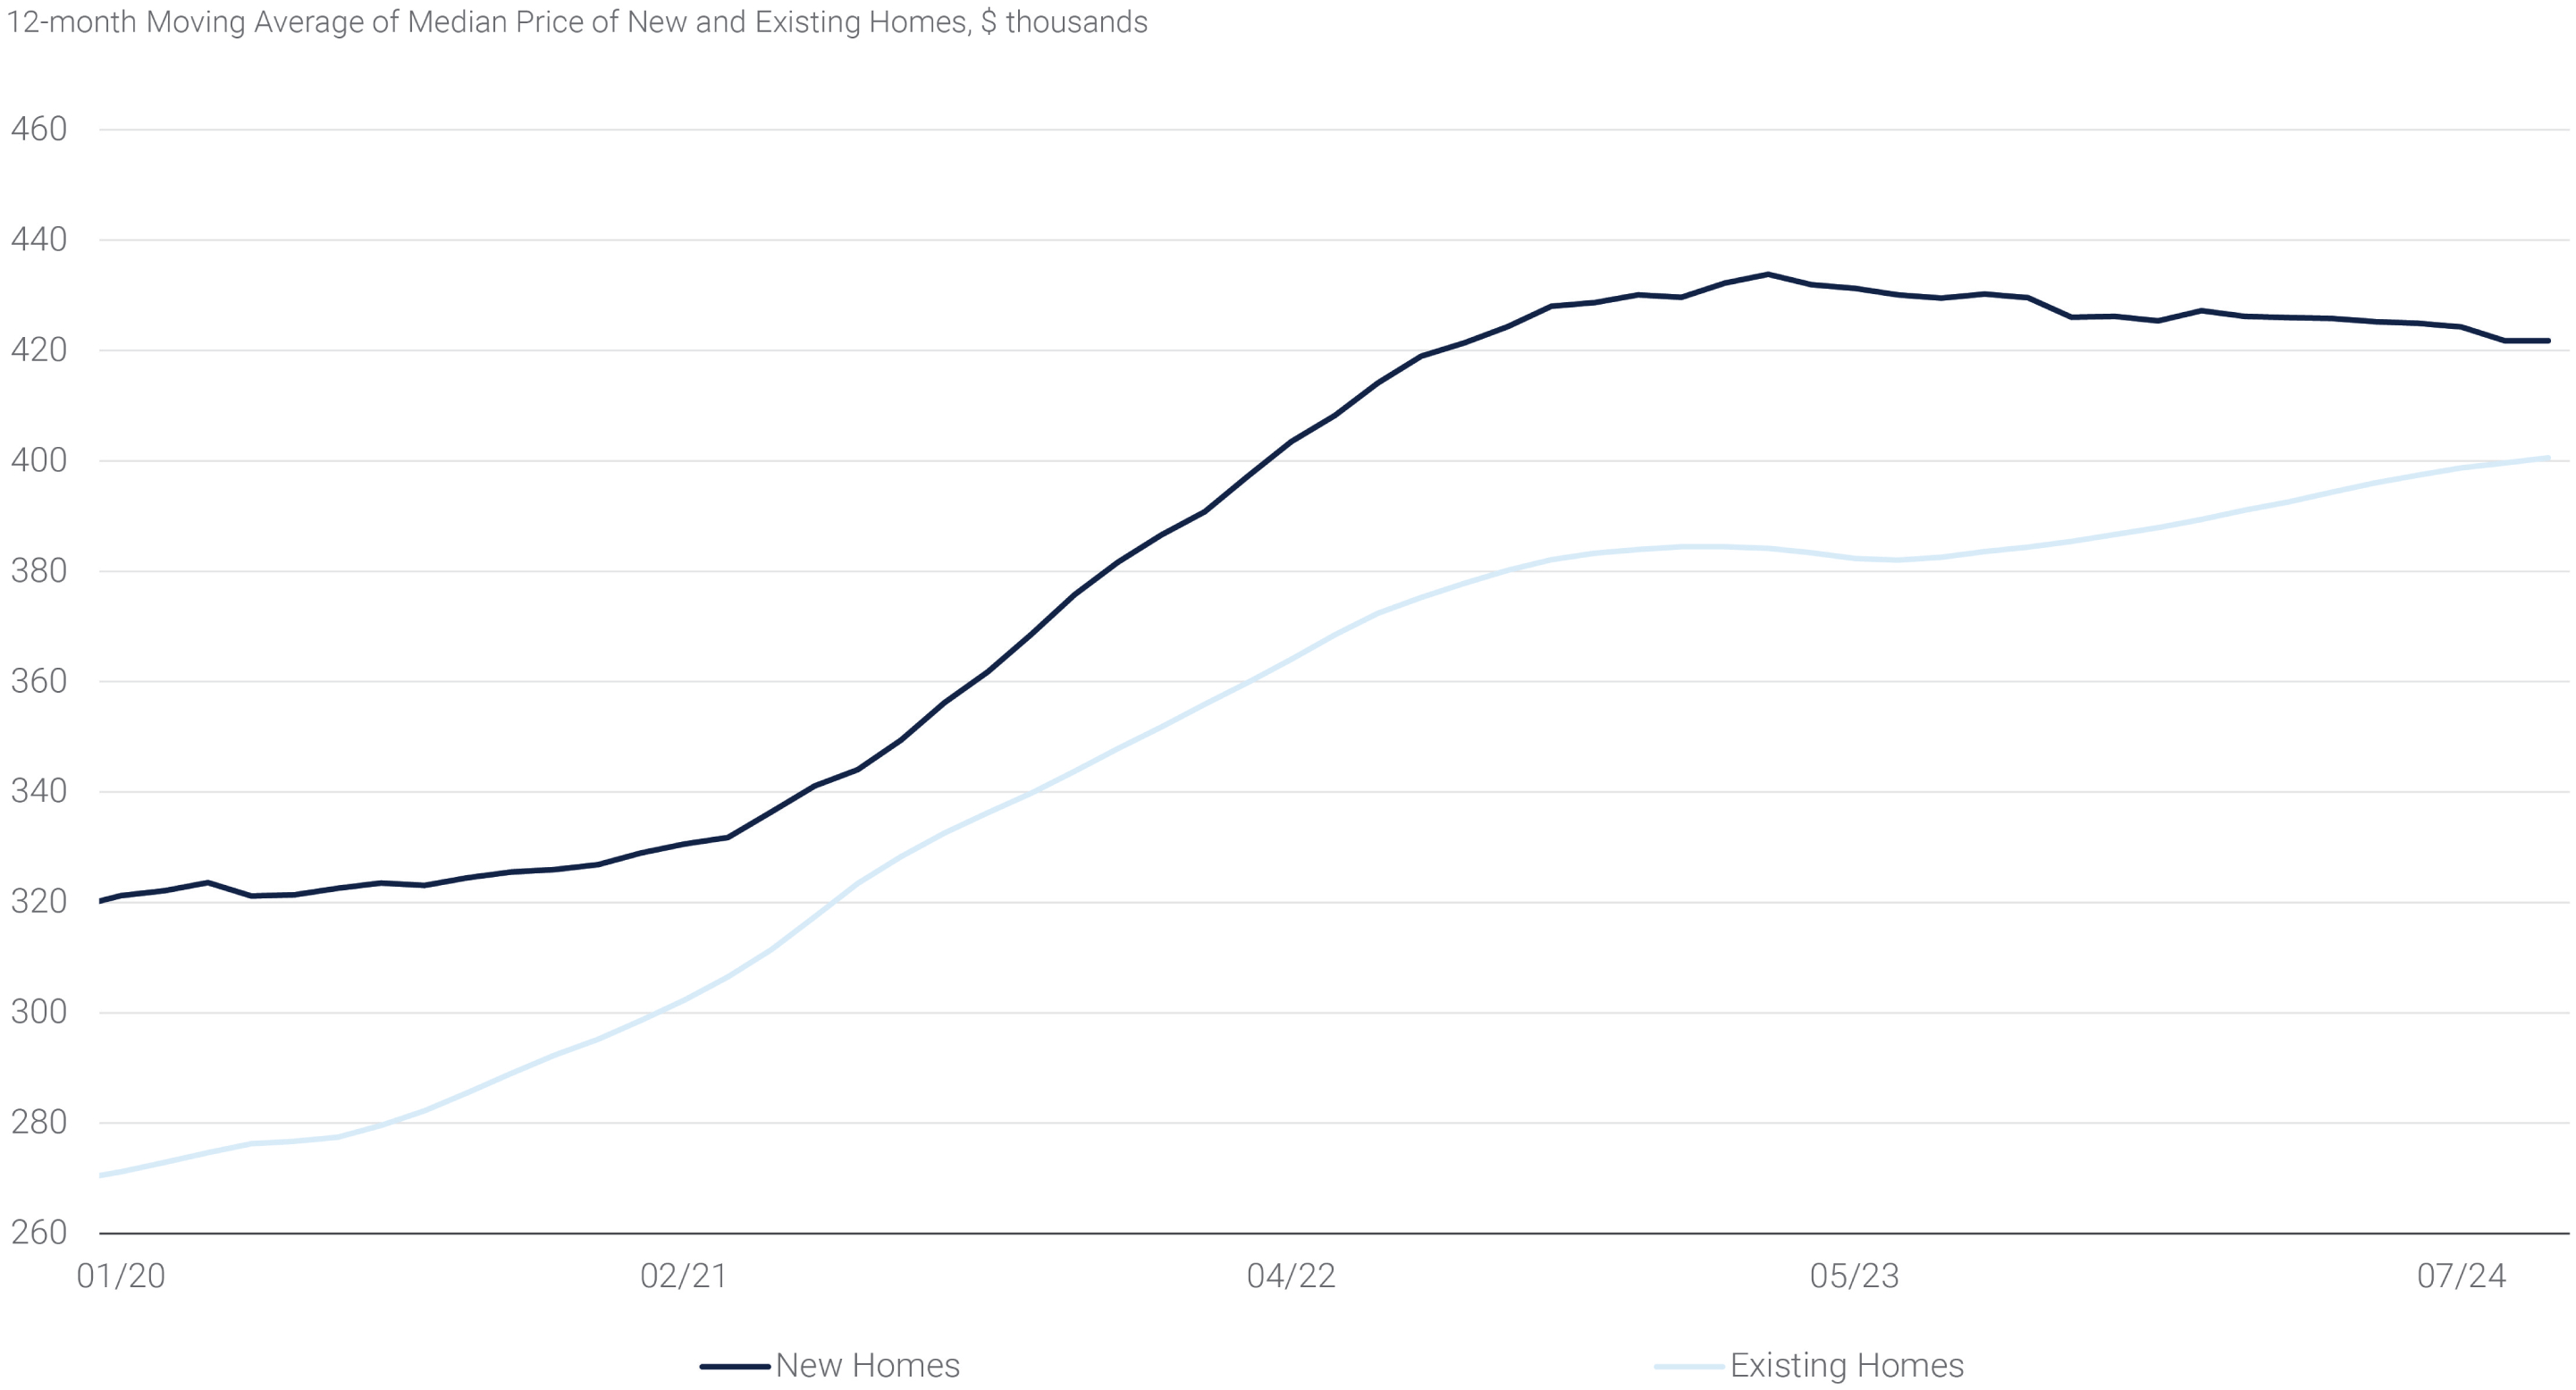
Lastly, despite healthy optimism surrounding an uptick in activity following the Fed’s 50 basis point September rate cut, U.S housing activity remains lukewarm thus far. The residential market continues to be characterized by low levels of inventory that are challenging supply/demand dynamics, causing a divergence in home price trends, and exacerbating affordability issues. In September, existing home sales fell to 3.84 million annualized units, the lowest level seen in over a decade, though inventory levels continued to expand modestly. Meanwhile, new home sales rose as builders reportedly offered additional incentives to move new home inventories. As a result, the difference between new and existing home prices has narrowed in recent months (see panel 3).
Panel 3:
New and Existing Home Prices Are Diverging
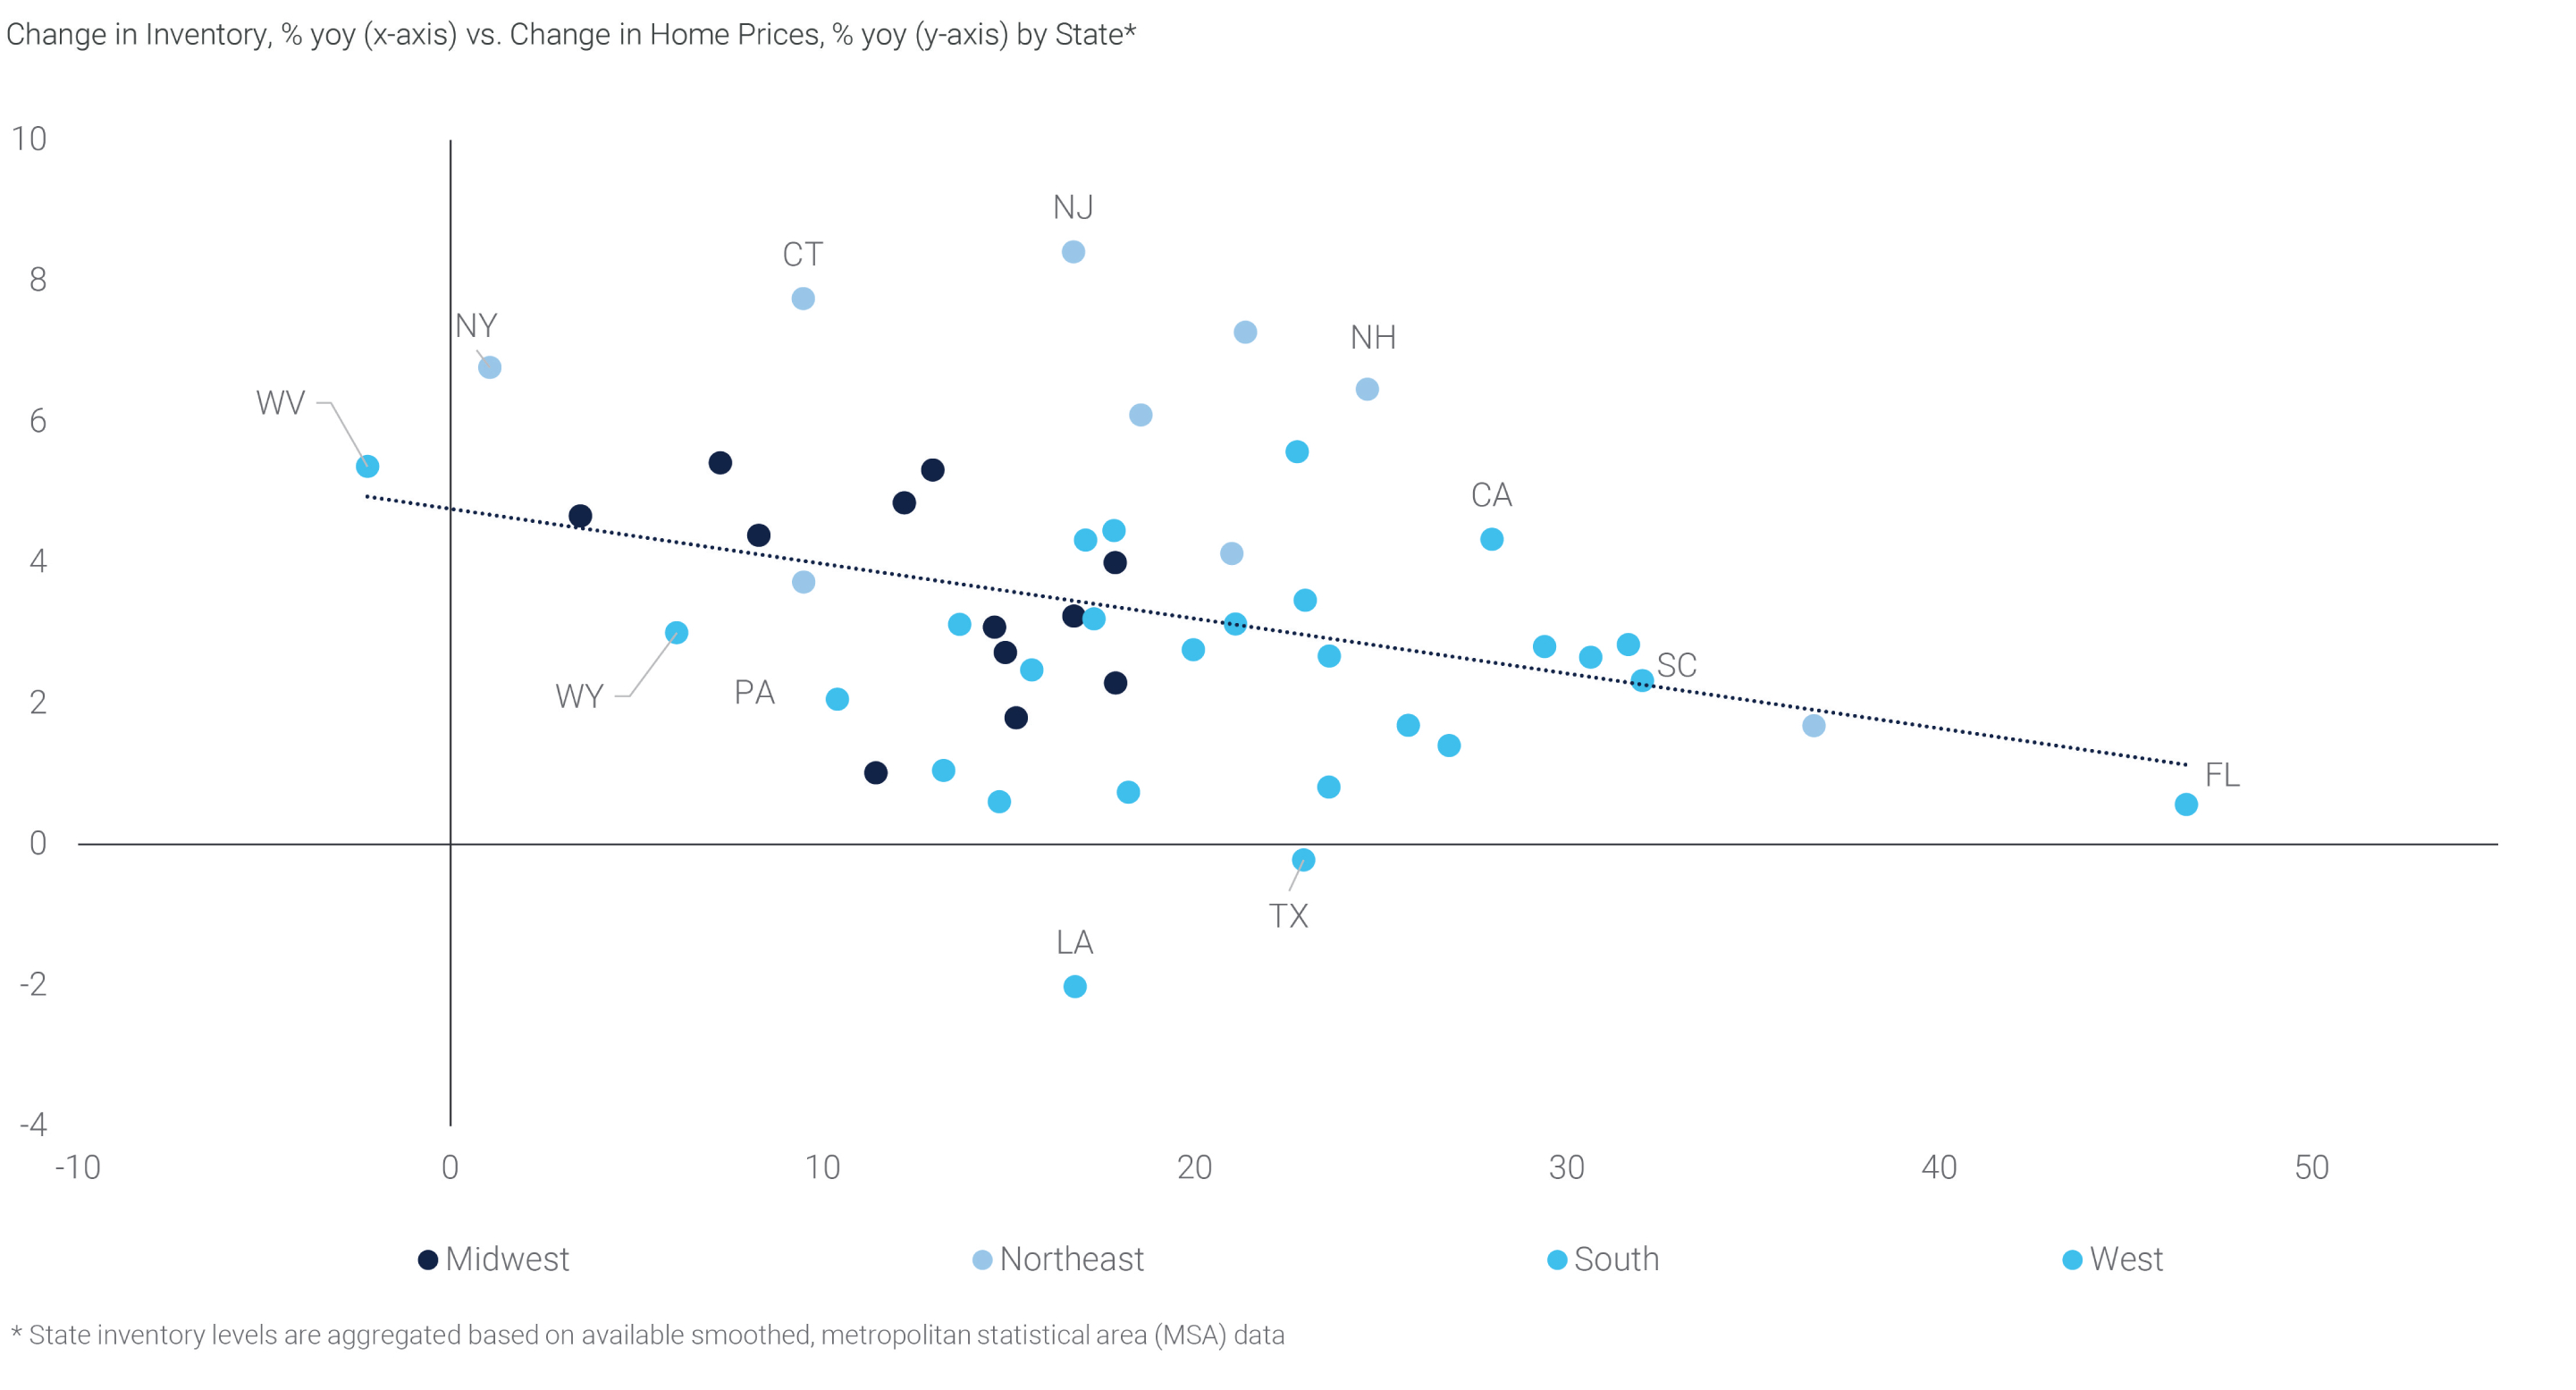
Interestingly, the prevalence of supply side shortages – a hallmark of the U.S. housing market in recent years – has been shifting on a regional basis this year. For instance, the Southern region of the United States has gained a fair amount of attention with metropolitan areas in Florida and South Carolina seeing some of the most robust inventory growth in the country as of September (see panel 4). Florida’s cities have added the equivalent of approximately 55 thousand units relative to 2023. On the other hand, states in the Northeast, such as New York, continue to see inventory shortages and a faster pace of price appreciation. For example, home prices in New York have risen 5.1% in the first nine months of the year according to Zillow, while declining 0.3% in Florida over the same timeframe. Regional differences may in part be due to outsized home price appreciation immediately following the onset of the pandemic and rising homeownership costs resulting from the increasing number of natural disasters in the area.(5)
Panel 4:
Housing Inventory Continues to Rise in the South
While regional inventory improvements are obvious, it is not entirely clear that this change of pace will be enough to increase housing market activity. Improved affordability remains contingent on softer home prices or a more significant decline in mortgage rates. For instance, in 2022, the median household would have spent 25% of their income when purchasing the median home as opposed to 16% on average during the prior twelve years. Today, the median front-end debt-to-income (“DTI”) ratio stands at an estimated 27%, which suggests mortgage rates would need to decline roughly 40 bps from current levels for DTIs to return to 2022 levels. Conversely, if mortgage rates were to stay unchanged, homeowners would need to see median household income rise nearly 5% to achieve the same effect on DTIs. As it is unlikely for incomes to move in such a pronounced matter in a short period of time, housing activity should continue to be sluggish absent further declines in mortgages rates or home prices.
Although the Fed has started cutting interest rates, market expectations for long-term Treasury rates are relatively stable in the currently expected soft landing scenario, raising doubts on the potential for pronounced mortgage rate declines. Even if inventory levels are rising in some states, unless the higher inventory is being offered at bigger price discounts, home prices should remain well supported – particularly in areas of lower inventory – maintaining the stalemate between prices and housing activity seen in recent quarters.